Team Management
UX Consultant
UX RESEARCH
UX Design
gen ai led risk assessment accelerator
A guided, AI‑assisted risk assessment tool that ingests customer responses/evidence, computes risk (Impact × Likelihood), generates actionable reports (PDF/JSON), and tracks assessment jobs and outcomes.



Main
Projects
About
Awards
Testemony
Contact
Legal:
© 2026 GoutamPro
Rights & copyrights reserved.



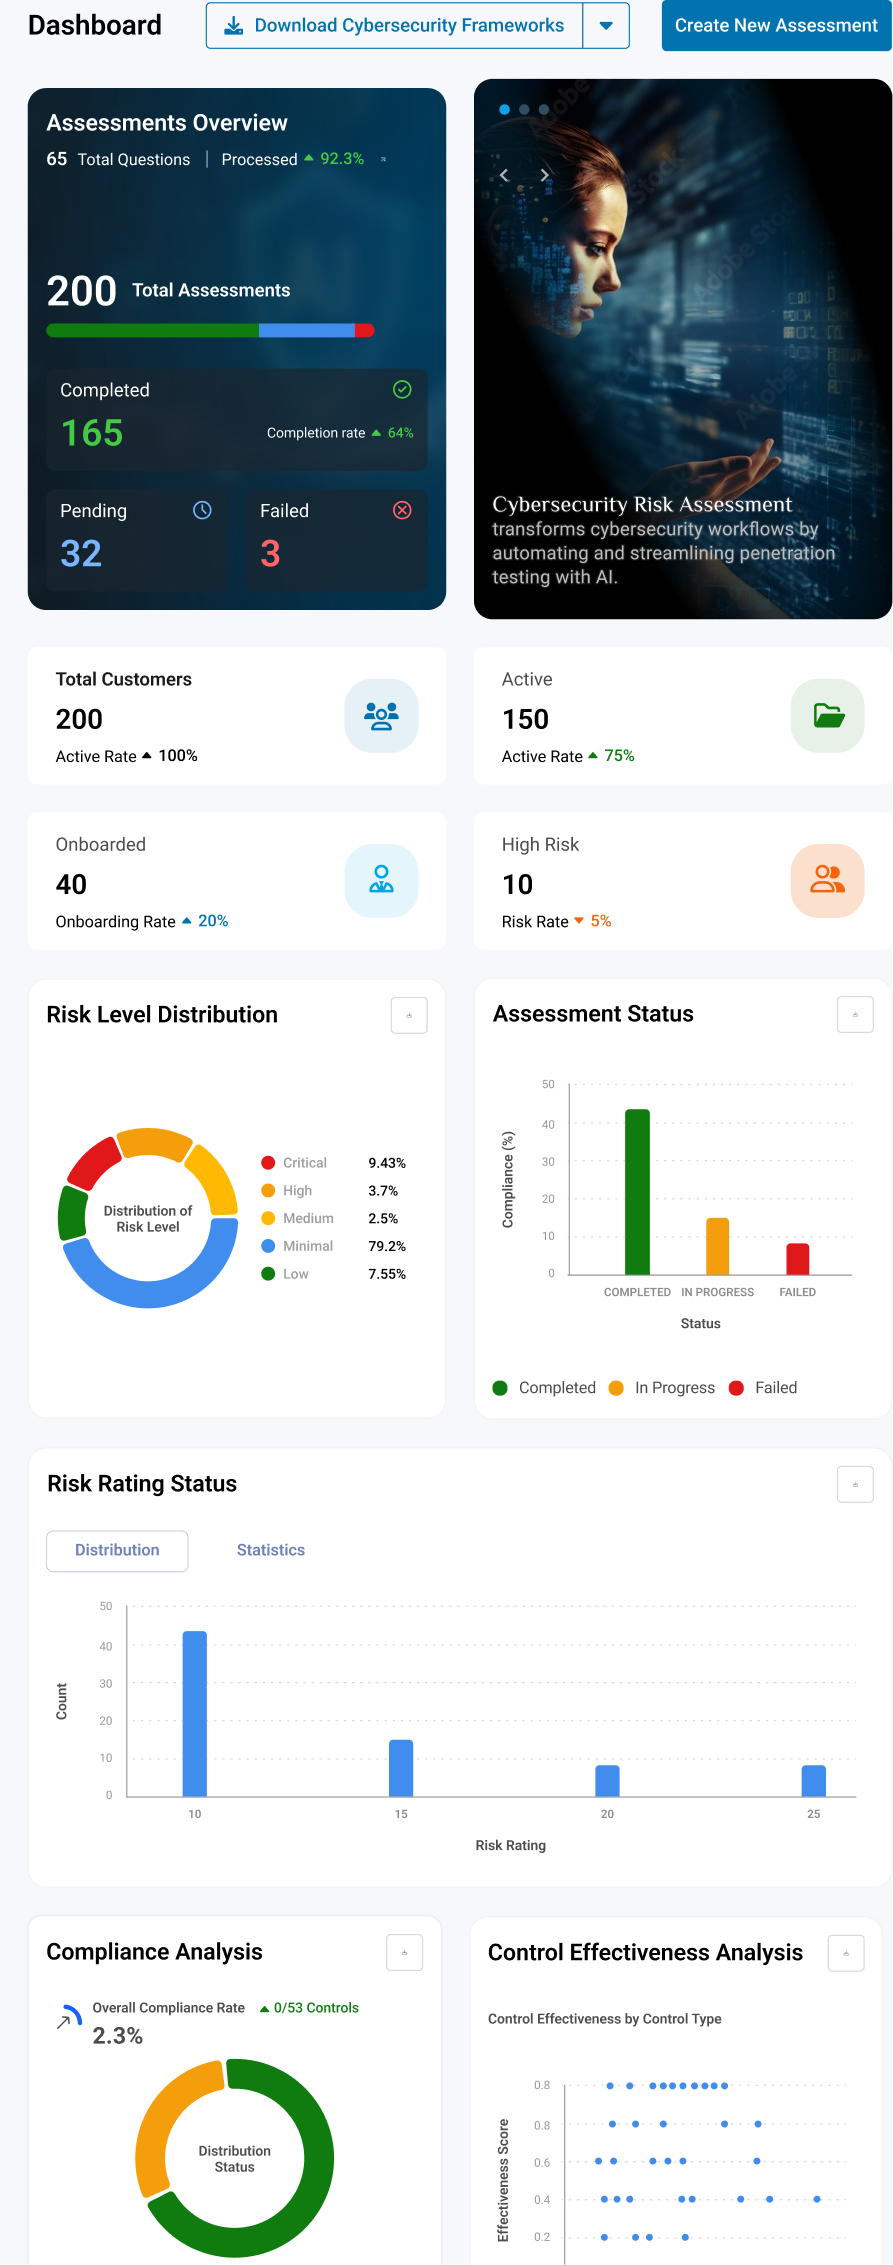
200
Total Assessments
Completed

165
Completion rate
64%

Pending

32
Failed

3



Transform Risk Management with AI
AI Effort
85%

Human Effort
15%





UX Strategy & Design Principles - Gen AI Led Risk Assessment Accelerator
Problem
Traditional GRC audits are time‑consuming and manual, consultants must validate controls and policies system‑by‑system, often over weeks.
Solution
A guided, AI‑assisted risk assessment tool that ingests customer responses/evidence, computes risk (Impact × Likelihood), generates actionable reports (PDF/JSON), and tracks assessment jobs and outcomes.
Outcome
Faster assessments, consistent scoring, transparent methodology, and exportable deliverables for internal teams and customers. Reduces risk assessment cycle times by 70%
UX wireframes
Design System
UI Design
Content Strategy
Prototyping
Pattern Documentation
Prototyping
Behavior ANALYSIS
Team Management
Duration: 4 months, October 2025 to February 2026.Team: 1 designers, 1 Business Analyst, 1 copywriter, 3 dev team across India & USA.Deliverables: End-to-end IA, UI/UX, Dynamic Figma Prototypes, Design System.
Business Goals
To develop an AI-led Cybersecurity Risk Assessment Accelerator tool that automates manual GRC (Governance, Risk, and Compliance) processes, enabling organizations to:
- Automated risk scoring (Impact × Likelihood).
- Categorization of risk levels (Low, Medium, High, Very High).
- Recommendations for mitigation.
- Generate reports (PDF/JSON) for compliance and audit purposes.
- Offer dashboards for real-time monitoring of assessments and risk distribution.
- Validate AI performance by comparing AI-generated results with human assessments for accuracy and trust.

Project Approach
As our team developed the app, we went through a variety of phases from the research phase to the final design.
Design Thinking Process

Discovery
15%
Competitor Analysis
Hypotheses
Research
We conducted an in-depth analysis of competitors by studying their products and identifying key features, advantages and disadvantages

Define
30%
App Map
User Flow
UX Design
Wireframe
Testing
At this stage, me and my team worked systematically to determine the best ways to achieve the end goal within the application development.

Ideate
15%
Moodboard
Initial Style
Research
We conceptualized the visualization and design of the app. We created interface sketches, screen prototypes and general style of the application.

Solution
40%
Design System
Branding
UI Design
UX Design
Testing
We prepared the app for release, making sure it not only met all technical requirements, but also provided users with an aesthetic and satisfactory visual experience in line with the brand.
Competitor Scorecard
Vendor
Core Positioning
GenAI Features
Questionnaire Automation
Multi-Framework Support
Risk Quantification
AI Governance
Strengths
Limitations

NetSuite ERP
AuditBoard
Connected risk & audit platform
Agentic AI for scoping memos, cross-audit summaries, vendor assessments
Automates vendor questionnaires
ISO, SOC, SOX, NIST
Basic analytics
Human-in-the-loop approvals
Strong workflow AI, explainability
Enterprise complexity

ServiceNow GRC
ITSM-integrated GRC
AI Risk & Compliance lifecycle, AI asset inventory
Vendor risk workflows
ISO, NIST, HIPAA
Limited native quantification
AI impact assessments
Deep enterprise integration
High implementation effort

MetricStream
AI-first ConnectedGRC
ML-driven prioritization, regulatory intelligence
Third-party risk modules
Broad frameworks
Predictive analytics
Continuous assurance
Analyst-recognized leader (Analyst-recognized leader)
Complex rollout with longer implementation

OneTrust
Privacy & GRC automation
AI agents for privacy & third-party risk
Strong questionnaire automation
ISO, GDPR, HIPAA
Limited quantification
AI governance integrations
Scale & breadth
Overwhelming for small teams

LoginGate
No-code GRC workflows
Spark AI for record linking, autofill
Configurable vendor workflows
ISO, NIST, HIPAA
FAIR-based Monte Carlo
Configurable governance
Flexibility & quantification
Steep learning curve

Vanta
Continuous compliance
AI-powered questionnaire automation, AI Security Assessment
Best-in-class auto-answer
SOC2, ISO, HIPAA
Light quantification
AI posture assessment
Speeds security reviews
Limited enterprise GRC

ZenGRC
Compliance automation
AI assistant for control mapping & gap analysis
Manual + AI assist
ISO, NIST
Basic scoring
None
Analyst-grade automation
Limited dashboards

Drata
Compliance automation
Automated evidence collection
Manual questionnaires
SOC2, ISO
Basic scoring
None
Real-time monitoring
Limited AI depth
Features Scorecard
NetSuite ERP
AuditBoard
ServiceNow GRC
MetricStream
OneTrust
LoginGate
Vanta
ZenGRC
Drata
Features
5/8
7/8
8/8
7/8
8/8
7/8
5/8
3/8
AI-Powered Risk Scoring


Questionnaire Automation


Multi-Framework Mapping


Risk Quantification (FAIR)


AI Governance


Explainability & Audit Trail


Trust Artifacts (PDF/JSON)


Continuous Compliance Monitoring


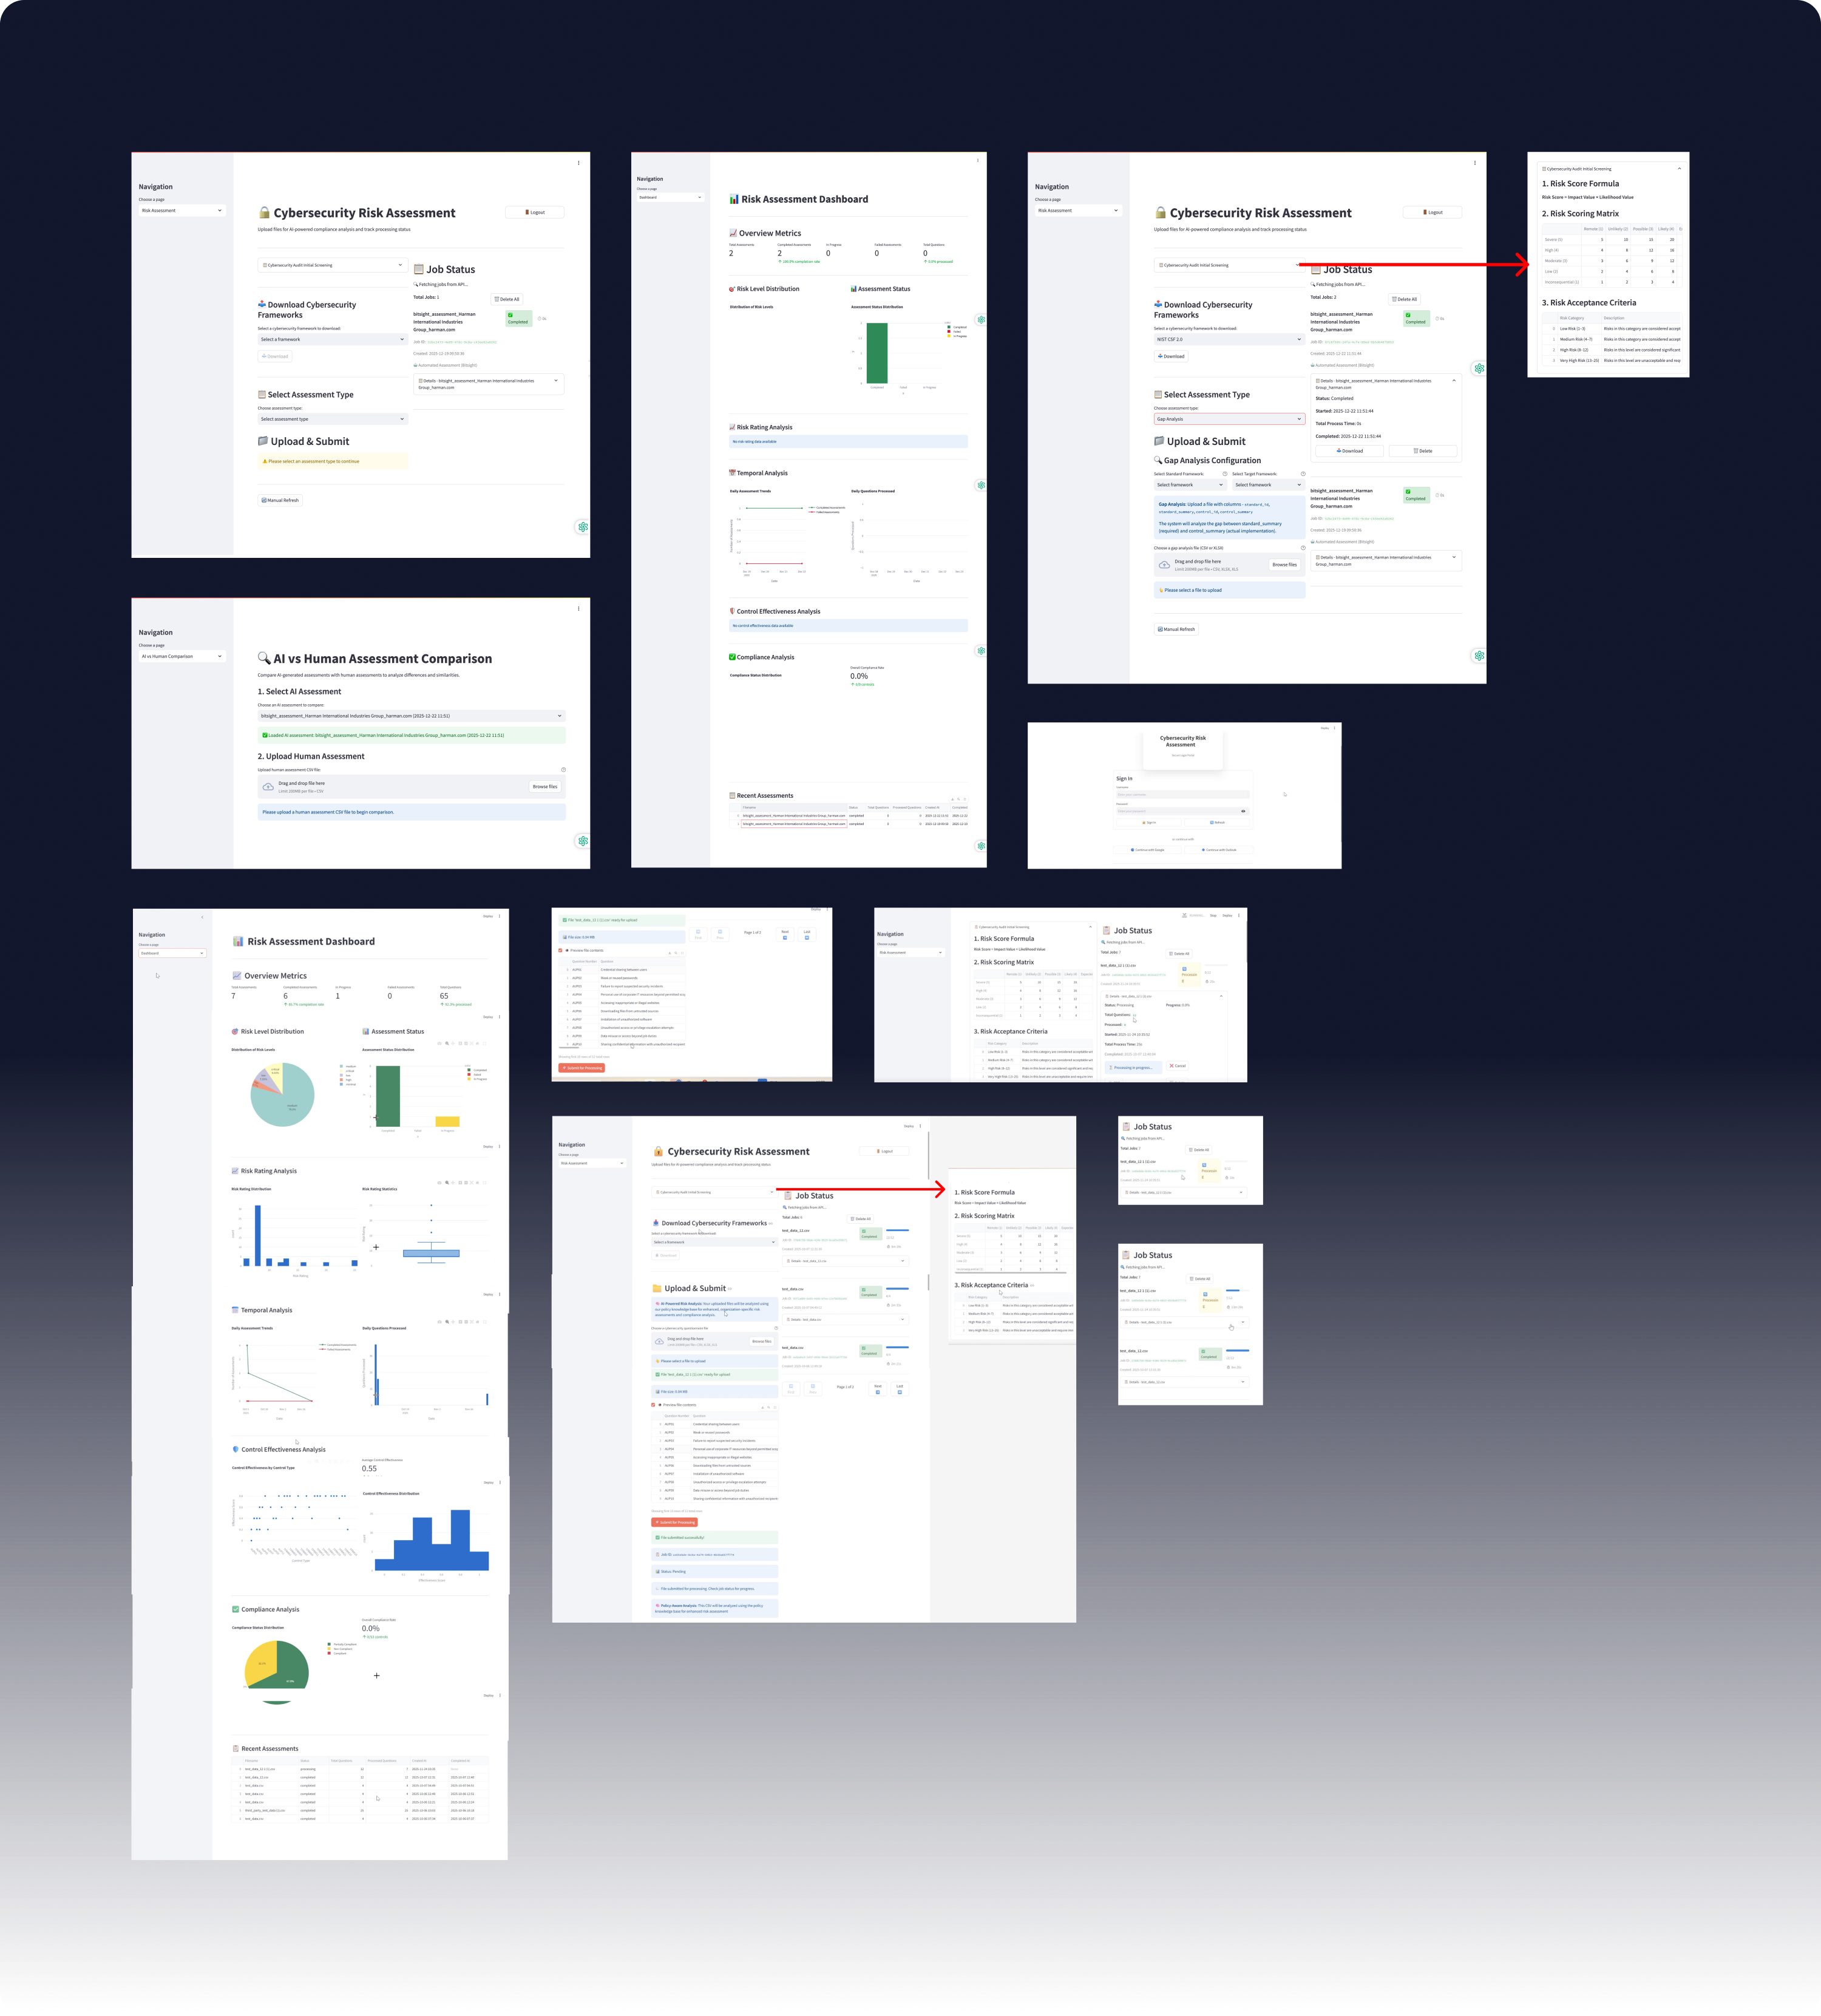
Existing App Screenshot
Define
User Profile or Persona

- Name: Priya Menon
- Age: 34
- Role: Principal Governance, Risk & Compliance (GRC) Consultant
- Industry: Enterprise Technology / Cybersecurity
- Location: Hybrid—splits time between the Bangalore campus and remote work
- Tech-savvy but prefers intuitive tools over complex systems
- Experience: 10+ years in audit, compliance, and cyber risk programs (ISO 27001, HIPAA, NIST CSF, GDPR)
Priya Menon
GRC Consultant (Internal Harman User)
- Efficient Risk Assessment: Automate compliance checks to reduce manual effort and speed up audits.
- Accurate Risk Scoring: Ensure reliable risk categorization based on frameworks like ISO 27001, HIPAA, NIST, GDPR.
- Generate Actionable Reports: Quickly produce detailed reports for internal audits, client, leadership and regulators reviews.
- Monitor Multiple Assessments: Use dashboards to track progress and risk distribution across projects.
- Automatic Tool: Reduce manual effort and repetitive tasks
Goal

- Manual Processes: Current assessments require weeks of manual checks, leading to delays.
- Complex Frameworks: Difficulty in interpreting multiple compliance frameworks without clear guidance.
- Data Handling Issues: Uploading evidence and responses via Excel can be error-prone.
- Limited Visibility: Lack of real-time dashboards for monitoring assessment status and risk trends.
- Trust Issue: Difficulty trusting AI-generated recommendations
Pain Points

Priya’s mission is to deliver fast, consistent, and transparent risk assessments. They believe that compliance should help the business move faster, not slow it down. That means standardizing how risk is scored (Impact × Likelihood), clarifying where evidence comes from, and ensuring every report can be understood by leadership, engineering, and auditors alike.
Mission & Mindset

Wants efficiency and accuracy
Needs transparency in scoring methodology
Prefers structured workflows and clear guidance
Values exportable, shareable outputs (PDF, JSON)
Motivations:

Works under tight deadlines
Handles multiple assessments simultaneously
Collaborates with IT and compliance teams
Comfortable with spreadsheets but expects automation
Behavioral Traits:

Guided stepper flow (Select Framework → Upload → Validate → Submit → Job Status → Results)
Inline validation for CSV/XLSX uploads
Real-time job status with progress and ETA
Multi-format export (PDF for stakeholders, JSON for integration)
Collapsible reference panel for scoring formula and matrix
AI vs Human comparison for trust-building
Preferred Features:

Priya began their career as an IT auditor, developing a strong foundation in control testing, evidence collection, and regulatory reporting. Over time, they moved into GRC consulting, leading multi‑framework assessments for product teams and business units. Priya’s credibility grew by translating complex security controls into practical, business-aligned recommendations. Recently, they’ve focused on modernizing assessment workflows—moving away from scattered spreadsheets and email threads to structured, automated processes that produce defensible, audit‑ready reports.
Background & Career Arc
User Flows and Map How the User Interacts with the Product.

User Journey Map & SWOT Analysis
User Steps
What is the each step of the user journey?
Awareness
Onboarding / Login
Framework Selection
Data Upload
Risk Processing
Dashboard Monitoring
Report Download
VI vs Human Comparison
User Actions
What action does the user take during each step?
Reads Harman email or marketing material to learn about the tool
Visits the official website for tool details.
Opens login page.
MFA (The Multi-Factor Authentication Process) prompt.
Navigates to dashboard.
Selects compliance framework (ISO, HIPAA, NIST, GDPR).
Reviews framework details.
Confirms selection.
Downloads sample Excel template.
Fills responses and evidence.
Uploads completed file.
Submits file for processing.
Monitors progress.
Waits for completion.
Views assessment status.
Checks risk level distribution.
Filters by date or framework.
Previews report summary.
Downloads PDF or JSON.
Shares report internally.
Uploads human assessment file.
Compares AI vs manual ratings.
Reviews visual charts.
Highlight time savings and AI cababilities.
Touchpoints
What is the user trying to accomplish?
Harman website.
Demo sessions.
Marketing emails.
Login page.
MFA (The Multi-Factor Authentication Process) prompt.
Welcome screen.
Dropdown menu.
Framework info pop-up.
Help section.
Upload section.
File validation screen.
Error messages.
Processing screen.
Progress bar.
Notification alerts.
Dashboard page.
Graphs and charts.
Filters and tabs.
Report page.
Download buttons.
Email integration.
Comparison module.
Charts and graphs.
Download comparison report.
Feelings & Thoughts
Use the emojis below to help illustrate how the user might be feeling.

Curious about reducing manual work.

Interested in AI-driven compliance.

Slight uncertainty about tool complexity.

Slight anxiety about MFA delays.
Wants quick access to dashboard.

Relief after successful login.
Confused about framework relevance.
Needs guidance for correct selection.
Wants confidence in choice.
Concerned about file format errors.

Wants confirmation of successful upload.
Relief after validation.
Impatient during long processing.
Curious about risk scoring.
Relief after completion.
Overwhelmed by too much data.
Wants quick insights.
Relief after finding key metrics.
Confident after seeing actionable insights.
Wants easy sharing.
Satisfaction with detailed report.
Interested in accuracy validation.
Wants clear differences highlighted.
Confidence in AI performance.
Pain Points
What’s not working well? What causes friction?
How many people does this affect?
Complex navigation and unclear steps
Lack of clarity on benefits.
No clear examples of use cases.
Limited visibility of ROI.
Login errors or slow loading.
MFA (AWS multi-factor authentication) process feels cumbersome.
No quick-start guide.
Complex framework names.
No explanation of differences.
Lack of tooltips.
File format mismatch.
No clear instructions.
Upload failures without reason.
No progress indicator.
Unclear estimated time.
Lack of transparency in scoring.
Excessive scrolling.
Poor visual hierarchy.
Hard-to-read charts.
Hard to locate download option.
No preview before download.
Limited format options.
Complex charts.
Hard to interpret differences.
No summary insights.
Opportunities
How might we address these pain points? How big is the opportunity if we correct this pain point?
What are new ways to serve this person?
Provide clear onboarding guides
Share case studies and success stories.
Highlight time savings and compliance accuracy.
Streamline MFA (AWS multi-factor authentication) process.
Offer “Remember Device” option.
Provide a quick-start tutorial post-login.
Add tooltips and descriptions.
Provide recommended framework based on industry.
Offer a short video guide.
Provide sample templates.
Add real-time validation.
Show success confirmation
Show real-time progress bar.
Display estimated completion time.
Explain scoring logic briefly.
Use card-based dashboard layout for clarity
Prioritize KPIs (Prioritize KPIs at top) at top.
Add drill-down filters.
Add clear download buttons.
Provide preview option.
Offer multiple formats (PDF, JSON, CSV).
Simplify visuals with color coding.
Provide summary comparison metrics.
Add downloadable comparison report.
Define UX Strategy and Outline Key Design Principles.
Pain Point
UX Strategy
Feature
Manual processes
Guided stepper flow
Framework → Upload Validate → Submit
Fragmented evidence collection:
Users struggle because evidence is scattered across multiple sources (emails, spreadsheets, ticketing systems), making it hard to consolidate and validate.
Structured intake & validation:
Provide a single, guided interface for uploading and validating evidence in a standardized format.
Accepts CSV/XLSX templates with predefined columns (QuestionId, Response, Evidence).
Performs real-time validation:
- Mandatory fields present.
- Allowed response values (Yes, No, Partial, NA).
- Evidence length ≥ 20 characters.
Displays inline error/warning messages and a preview table for quick fixes.
Complex frameworks:
Users often struggle to understand and apply multiple compliance frameworks (ISO 27001, HIPAA, NIST CSF, GDPR). This complexity leads to confusion, misalignment, and errors during risk assessments.
Contextual Help & Reference Panel:
Provide easy access to framework-related guidance without overwhelming the main workflow. Keep the help content visible but unobtrusive.
Collapsible Risk Formula & Matrix:
- What it includes:
- Risk Score Formula: Shows how risk is calculated (Impact × Likelihood).
- Risk Scoring Matrix: Displays the 5×5 grid for scoring categories.
- Risk Acceptance Criteria: Defines thresholds (Low, Medium, High, Very High).
- Design Approach:
- Place these elements in a collapsible side panel or accordion sections.
- Default state: collapsed (to reduce clutter).
- Expandable on demand for transparency and user confidence.
Poor visibility
Real-time job status dashboard
Progress bar, ETA, cancel/retry options
Inconsistent scoring:
Different auditors apply subjective interpretations of risk, leading to inconsistent results across assessments. This makes it hard to justify decisions and maintain compliance standards.
Standardized Formula Display:
Show the exact formula used for risk calculation to ensure transparency and consistency across all assessments.
Impact × Likelihood Scoring Matrix:
- What it includes:
- Formula: Risk Score = Impact × Likelihood
- Matrix: A 5×5 grid mapping impact and likelihood values to risk scores.
- Categories:
- 1–3 = Low
- 4–7 = Medium
- 8–12 = High
- 13–25 = Very High
Limited reporting:
Users often receive static PDF reports that are hard to share, analyze, or integrate with other systems. This limits flexibility and slows down compliance workflows.
Multi-format export:
Provide multiple export options so users can choose the format that best fits their needs—human-readable for stakeholders and machine-readable for system integration.
PDF & JSON Downloads:
- PDF Report:
- Includes summary (risk distribution, compliance status).
- Detailed per-question analysis (impact, likelihood, risk score, recommendations).
- Print-ready for leadership and audit purposes.
- JSON Export:
- Structured data for integration with GRC platforms or dashboards.
- Includes scoring details, evidence analysis, and recommendations.
UX Challenges:
Existing compliance tools often have cluttered screens, unclear navigation, and jargon-heavy language. This overwhelms users and increases cognitive load, leading to mistakes or abandonment.
Minimalist UI & Clear Hierarchy:
Design a clean, structured interface that guides users through the process step-by-step, reducing complexity and improving usability.
Stepper, Cards, Tooltips:
- Stepper:
- Displays the entire process as sequential steps (Select Framework → Upload → Validate → Submit → Job Status → Results).
- Highlights the current step and completed steps for clarity.
- Cards:
- Break down tasks into visually distinct sections (Framework Selection, Upload & Validate, Submit, Job Status).
- Avoid long scrolling by grouping related actions.
- Tooltips & Microcopy:
- Provide contextual help for complex terms (e.g., “Impact × Likelihood”).
- Offer short hints near input fields to reduce errors.
Trust in Al:
Users often hesitate to rely on AI-generated risk scores and recommendations because they lack visibility into how decisions are made and whether they align with human judgment.
Comparison View & Rationale:
Provide transparency by showing side-by-side comparisons of AI and human assessments, along with detailed reasoning for AI decisions.
AI vs Human Comparison Module
- What it includes:
- Upload human assessment file for benchmarking.
- Display comparison charts (bar graphs, difference metrics).
- Highlight areas of agreement and discrepancy.
- Show AI rationale for each recommendation (why a control is marked high risk).
- Design Approach:
- Accessible via a dedicated tab or section after job completion.
- Visual indicators for confidence levels and justification text.
- Export comparison report in PDF/JSON for audit purposes.
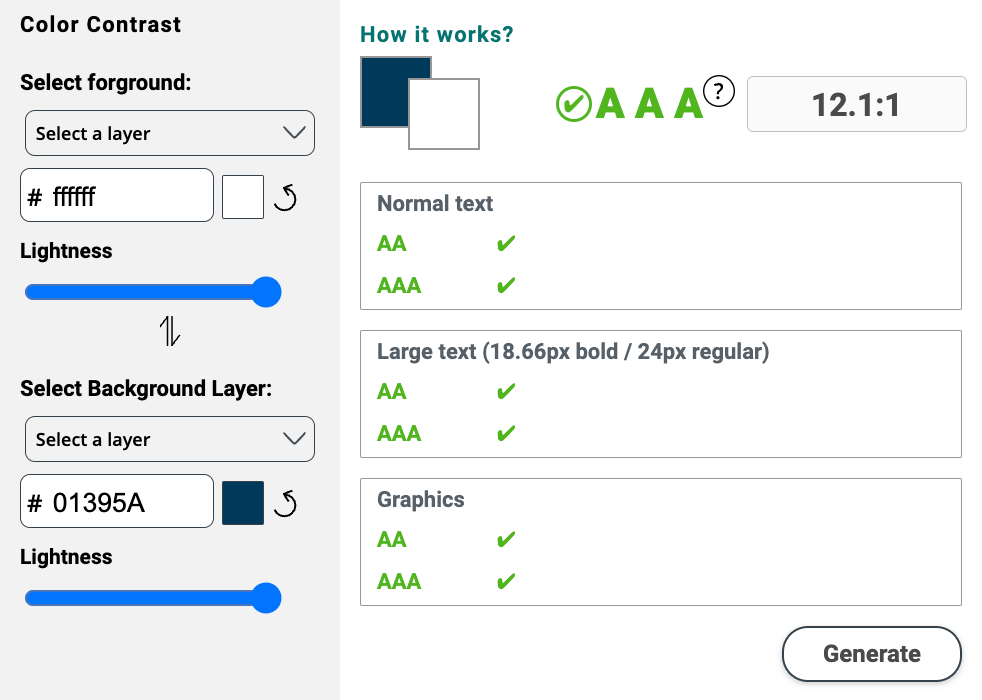
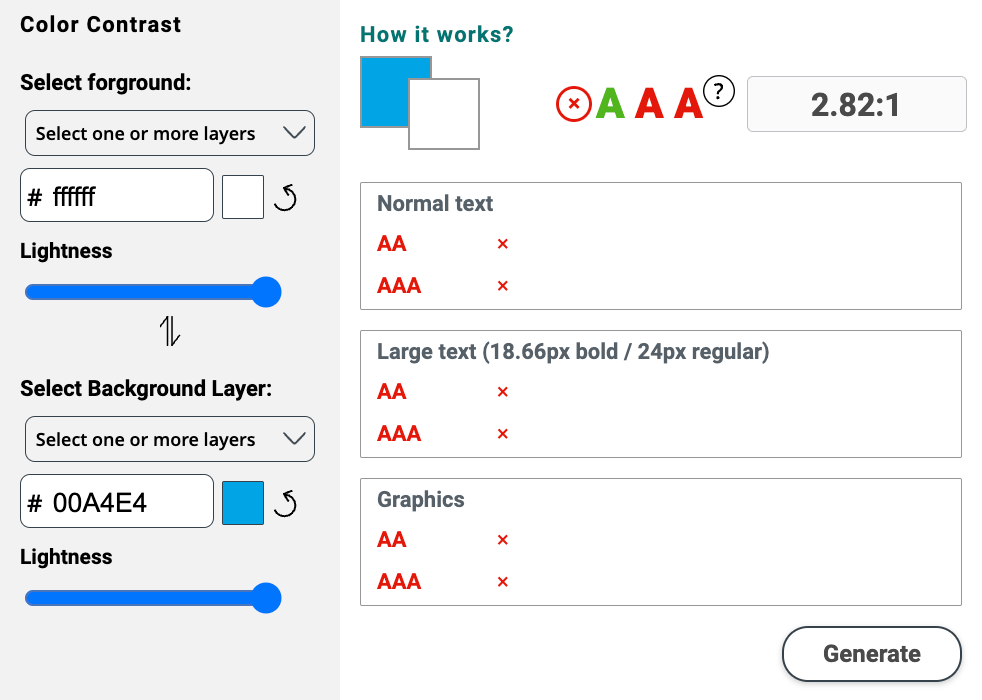
Accessibility Guidelines
01
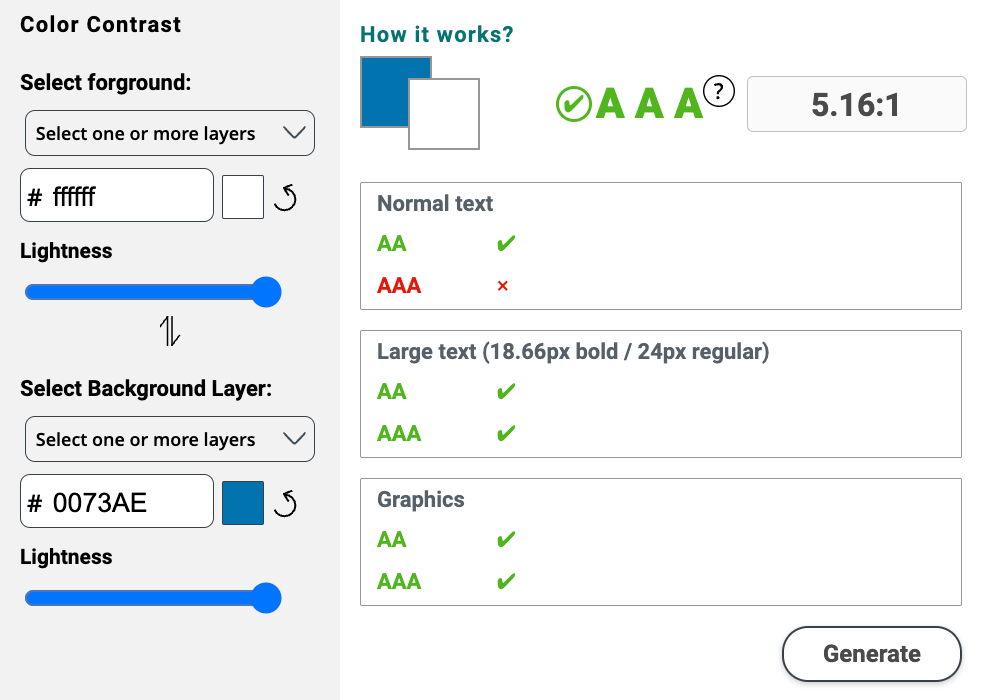
Web Content Accessibility Guidelines (WCAG) 2.2

The Web Content Accessibility Guidelines (WCAG) 2.2 is a set of recommendations for making web content more accessible to people with disabilities. The guidelines cover a wide range of disabilities, including: .
By following these guidelines, we make content more accessible to a wide range of people with disabilities, including
- Blindness and low vision
- Deafness and hearing loss
- Limited movement
- Speech disabilities
- Photosensitivity
- Learning disabilities
- Cognitive limitations
In addition, these guidelines often makes Web content more usable to everyone in general.
About WCAG 2.2
02
Conformance levels
The WCAG guidelines have three levels of conformance that you can meet; A, AA and AAA, and each is progressively harder.
- A: Lowest
- AA: Mid Range
- AAA: Highest
Timely Delivery
Delivery Plan based on Priority & Complexity
Delivery Plan based on Priority & Complexity

Duration - 10 Weeks
Few Key Screens (14-17 max) - ESIM App that covers one basic user flow for each category Full version of the product to be discussed once the draft version is approved.
Disclaimer: Design timeline can be reduced based on additional resource allocation.
Months
December
January
Weeks
Week 1
Week 2
Week 3
Week 4
Week 5
Week 6
Week 7
Week 8
Week 9
Research
a. Understand business goals and user needs and document it.
b. Use secondary research to identify user pain points.
c. Analyze competitors and document insights & best practices.
Define
a. Define clear problem statement. What needs to be solved?
b. Create user persona based on your understanding and research.
c. Visualize how user interact and generate user journey map.
Interaction Design
a. Identify and create IA.
b. List down the feature level screens.
c. Create end-to-end delivery plan based on priority and complexity.
Ideation
a. Outline layout and functionality and create lo-fi wireframes.
b. Create user flows and map how user interacts with the product.
c. Create clickable prototypes for testing.
d. review with reviewer/SME and validate design decisions.
Refine based on feedback and review again.
Visual Design
a. Do your design research and create mood board.
b. Define branding guidelines with color pallet, typography etc.
c. Create responsive visual designs with latest design trends.
d. Build design system while working on the VD.
e. Build clickable and dynamic prototypes with variables and conditions.
Video Presentation & Case Study
a. Create Video Presentation and Developer Hand-off
b. Detailed case study presentation.

Today
Interaction Design
Information Architecture (IA)

Feature-Level Screens
Login, Registration, Authintacation, Forgot Password
Authentication and access screens:
- Login Screen
- Registration (Sign-Up) Screen
- Authentication Screen
- Forgot Password Screen
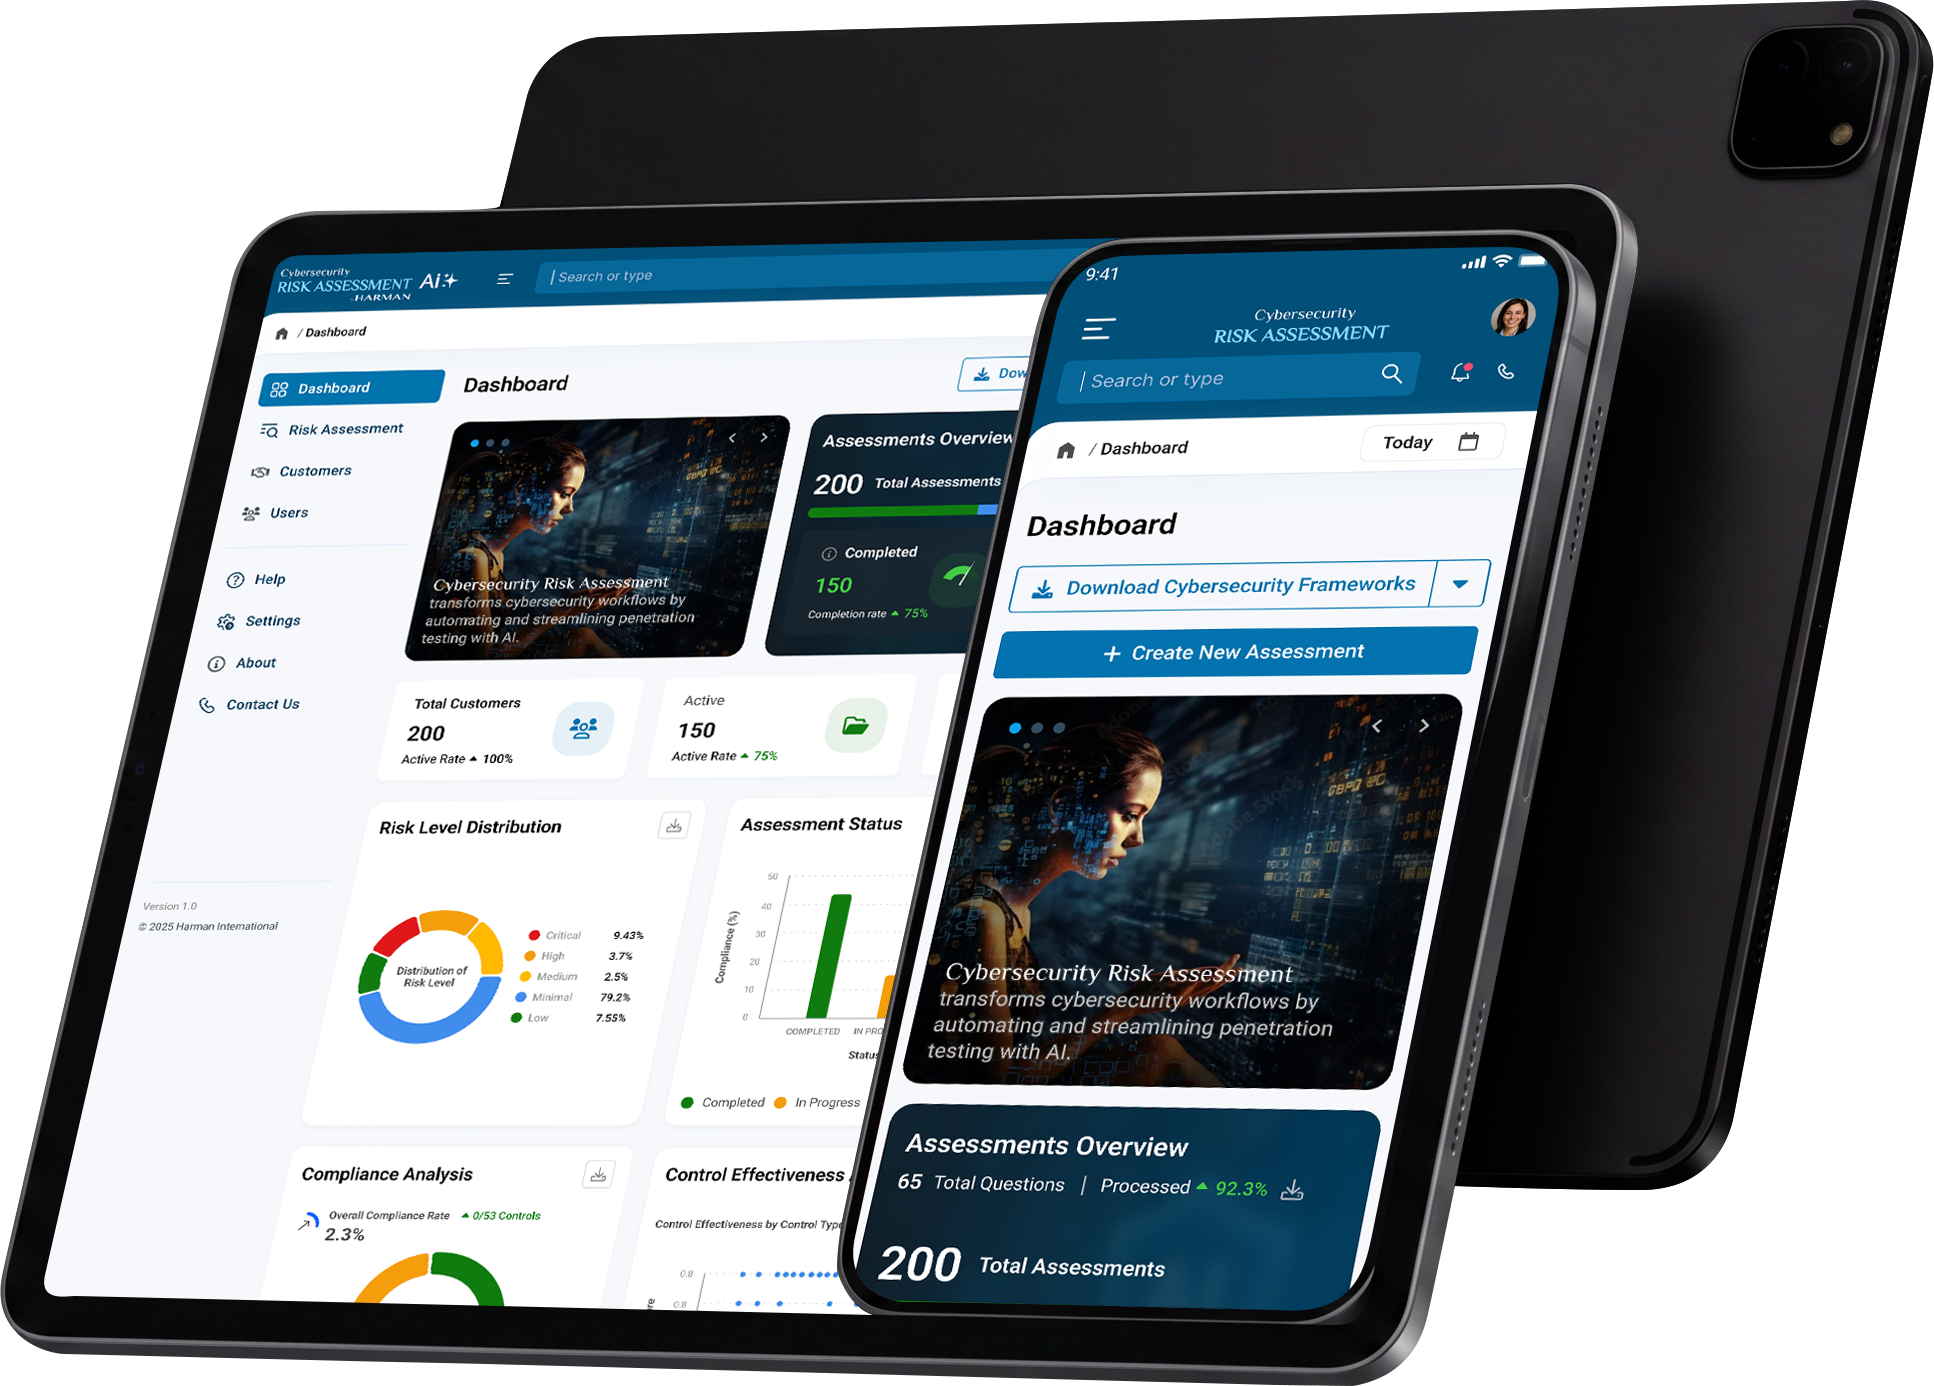
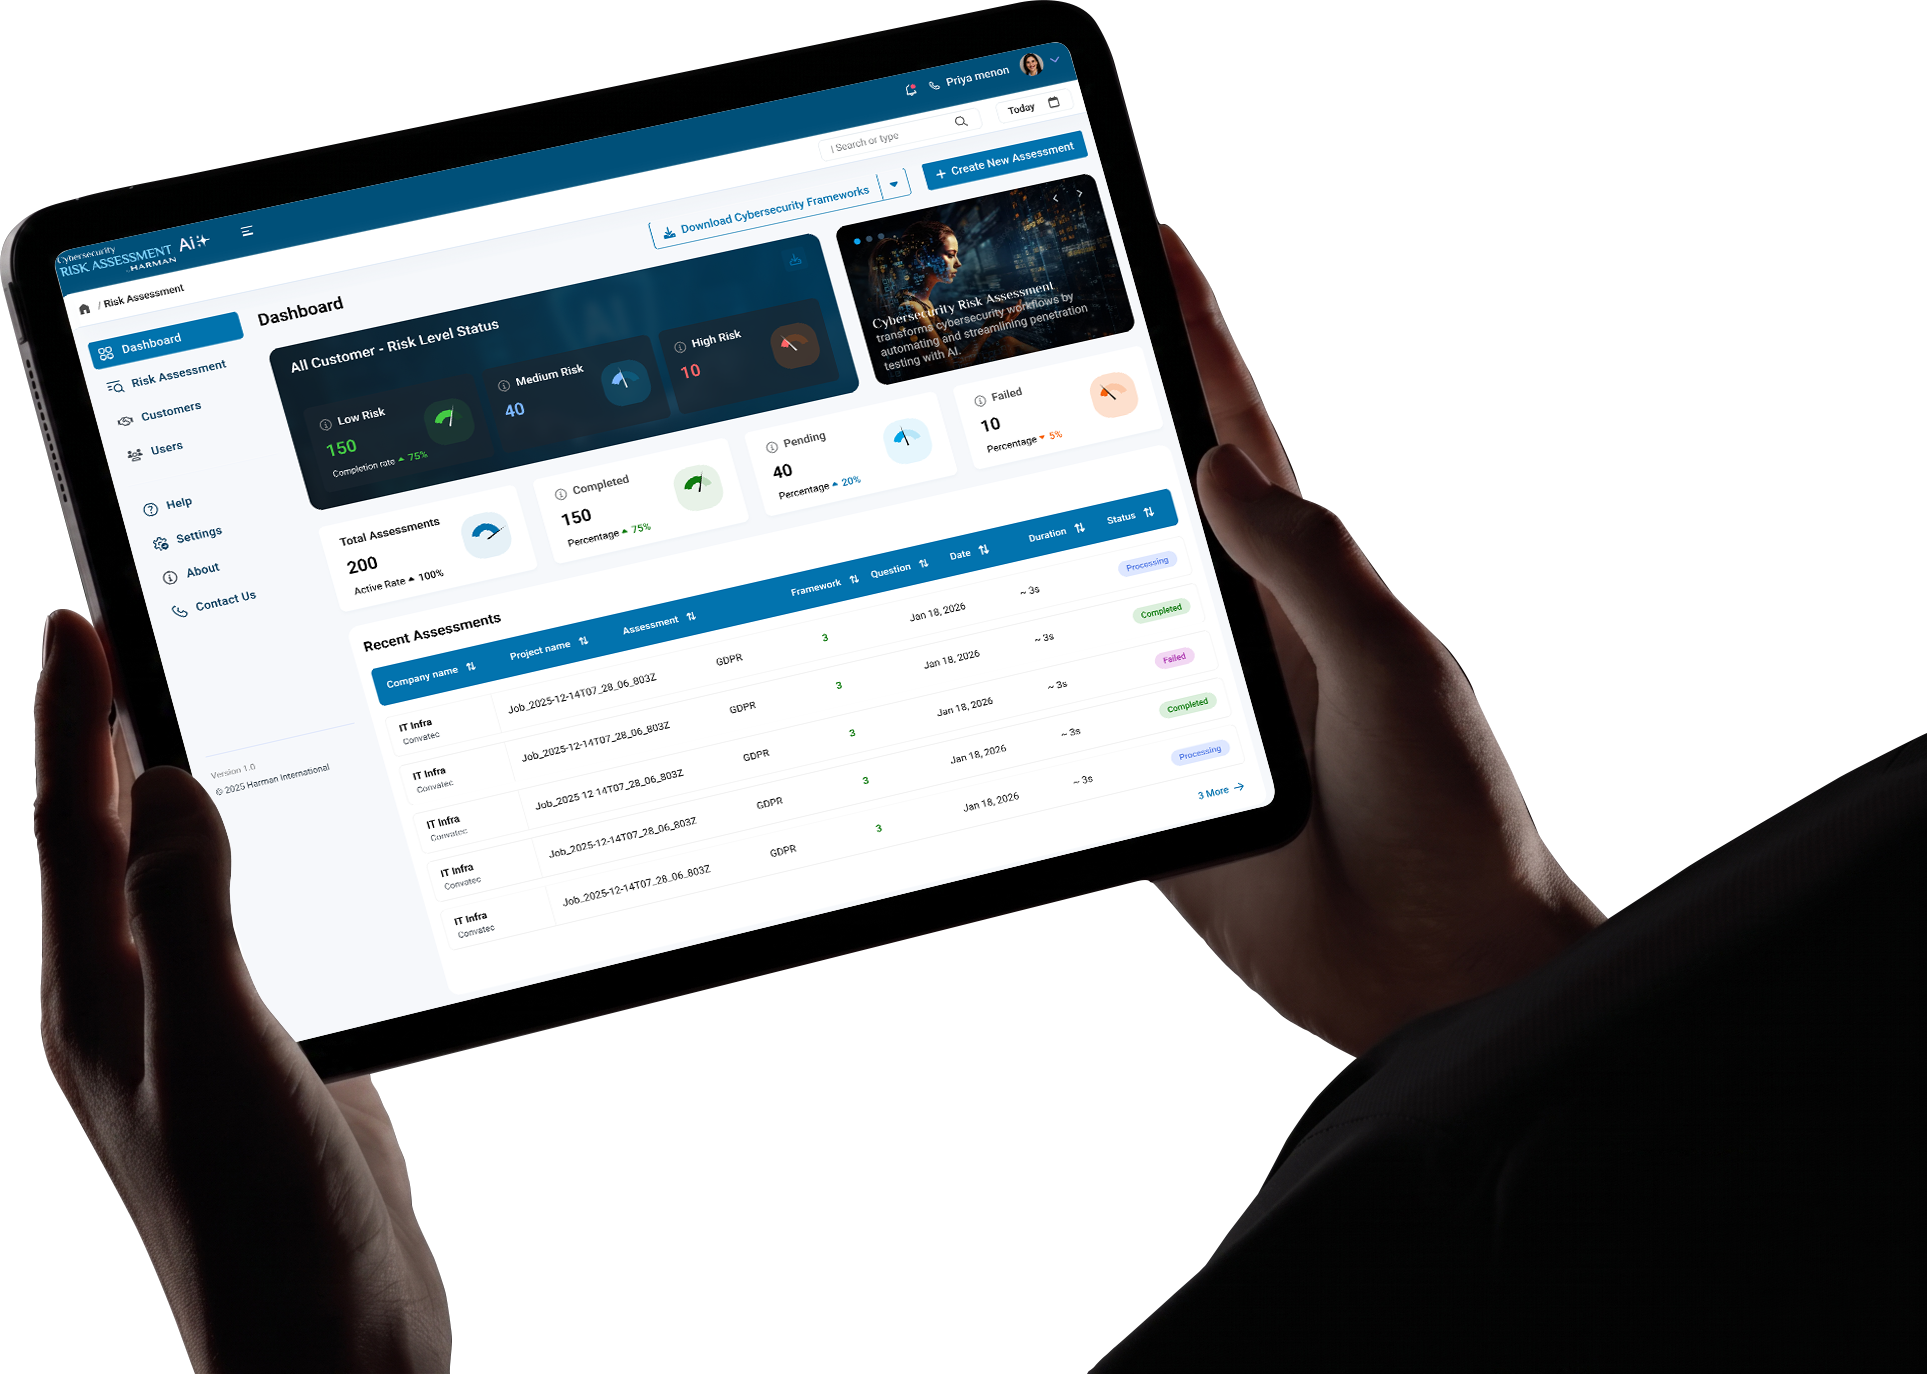
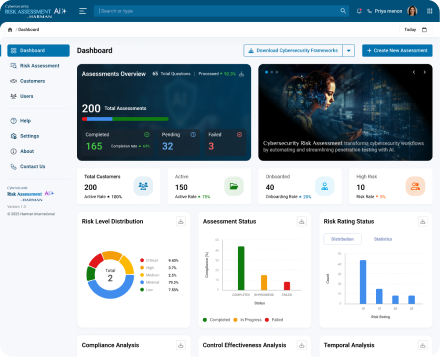
Dashboard Overview Screen
Displays key metrics such as:
- Total Assessments
- Customer Overview
- Risk Level Distribution (pie chart)
- Assessment progress indicators
Includes navigation bar and quick links for different modules.
Risk Assessment Detail Screen
Shows a list of assessments with columns like:
- Assessment Name
- Status (e.g., Completed, In Progress)
- Risk Score
- Framework applied (ISO, NIST, HIPAA)
Includes filtering and sorting options.
Compliance Framework Selection Screen
- Allows users to choose frameworks (ISO 27001, NIST CSF, HIPAA, GDPR).
- Displays framework-specific controls and compliance status.
Job Status & Processing Screen
- Tracks progress of uploaded questionnaires or evidence files.
- Shows percentage completion, time taken, and job history.
Report Generation Screen
- Provides downloadable reports in PDF and JSON formats.
- Includes summary of risk levels, recommendations, and evidence analysis.
AI vs Human Comparison Screen
- Compares AI-generated risk ratings with manual assessments.
- Displays visual charts and difference metrics.

Dashboard Overview Screen
- Risk Level Distribution chart.
- Assessment Status summary (Completed, In Progress, Failed).
- Quick access to recent assessments.
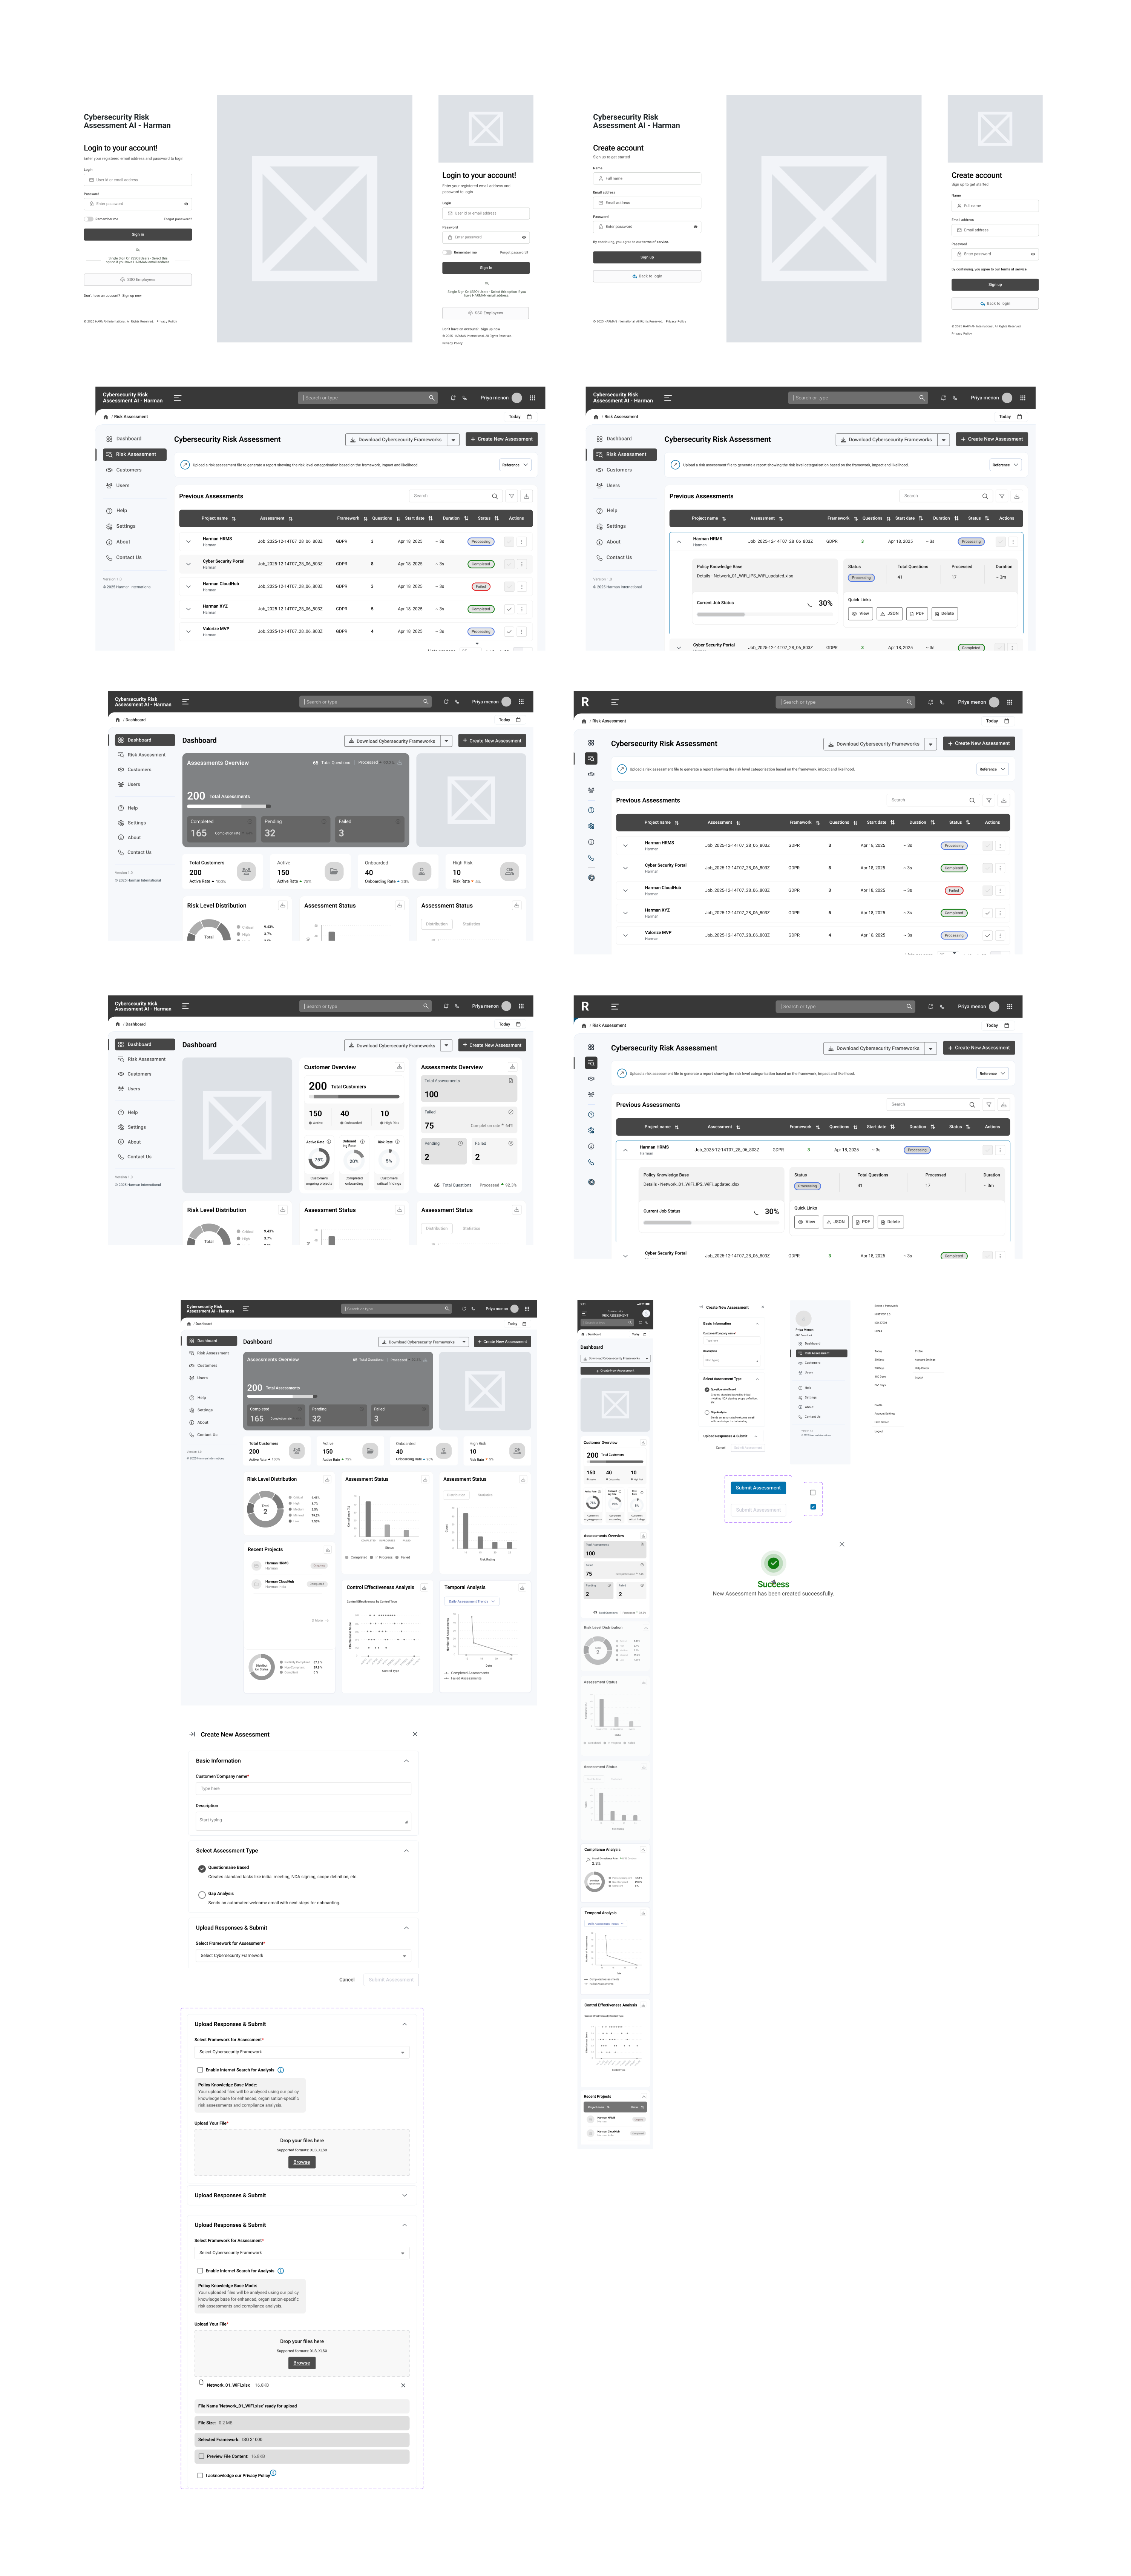
Lo-Fi Wireframes
Outline layout and functionality, and create lo-fi wireframes.
Visual Design
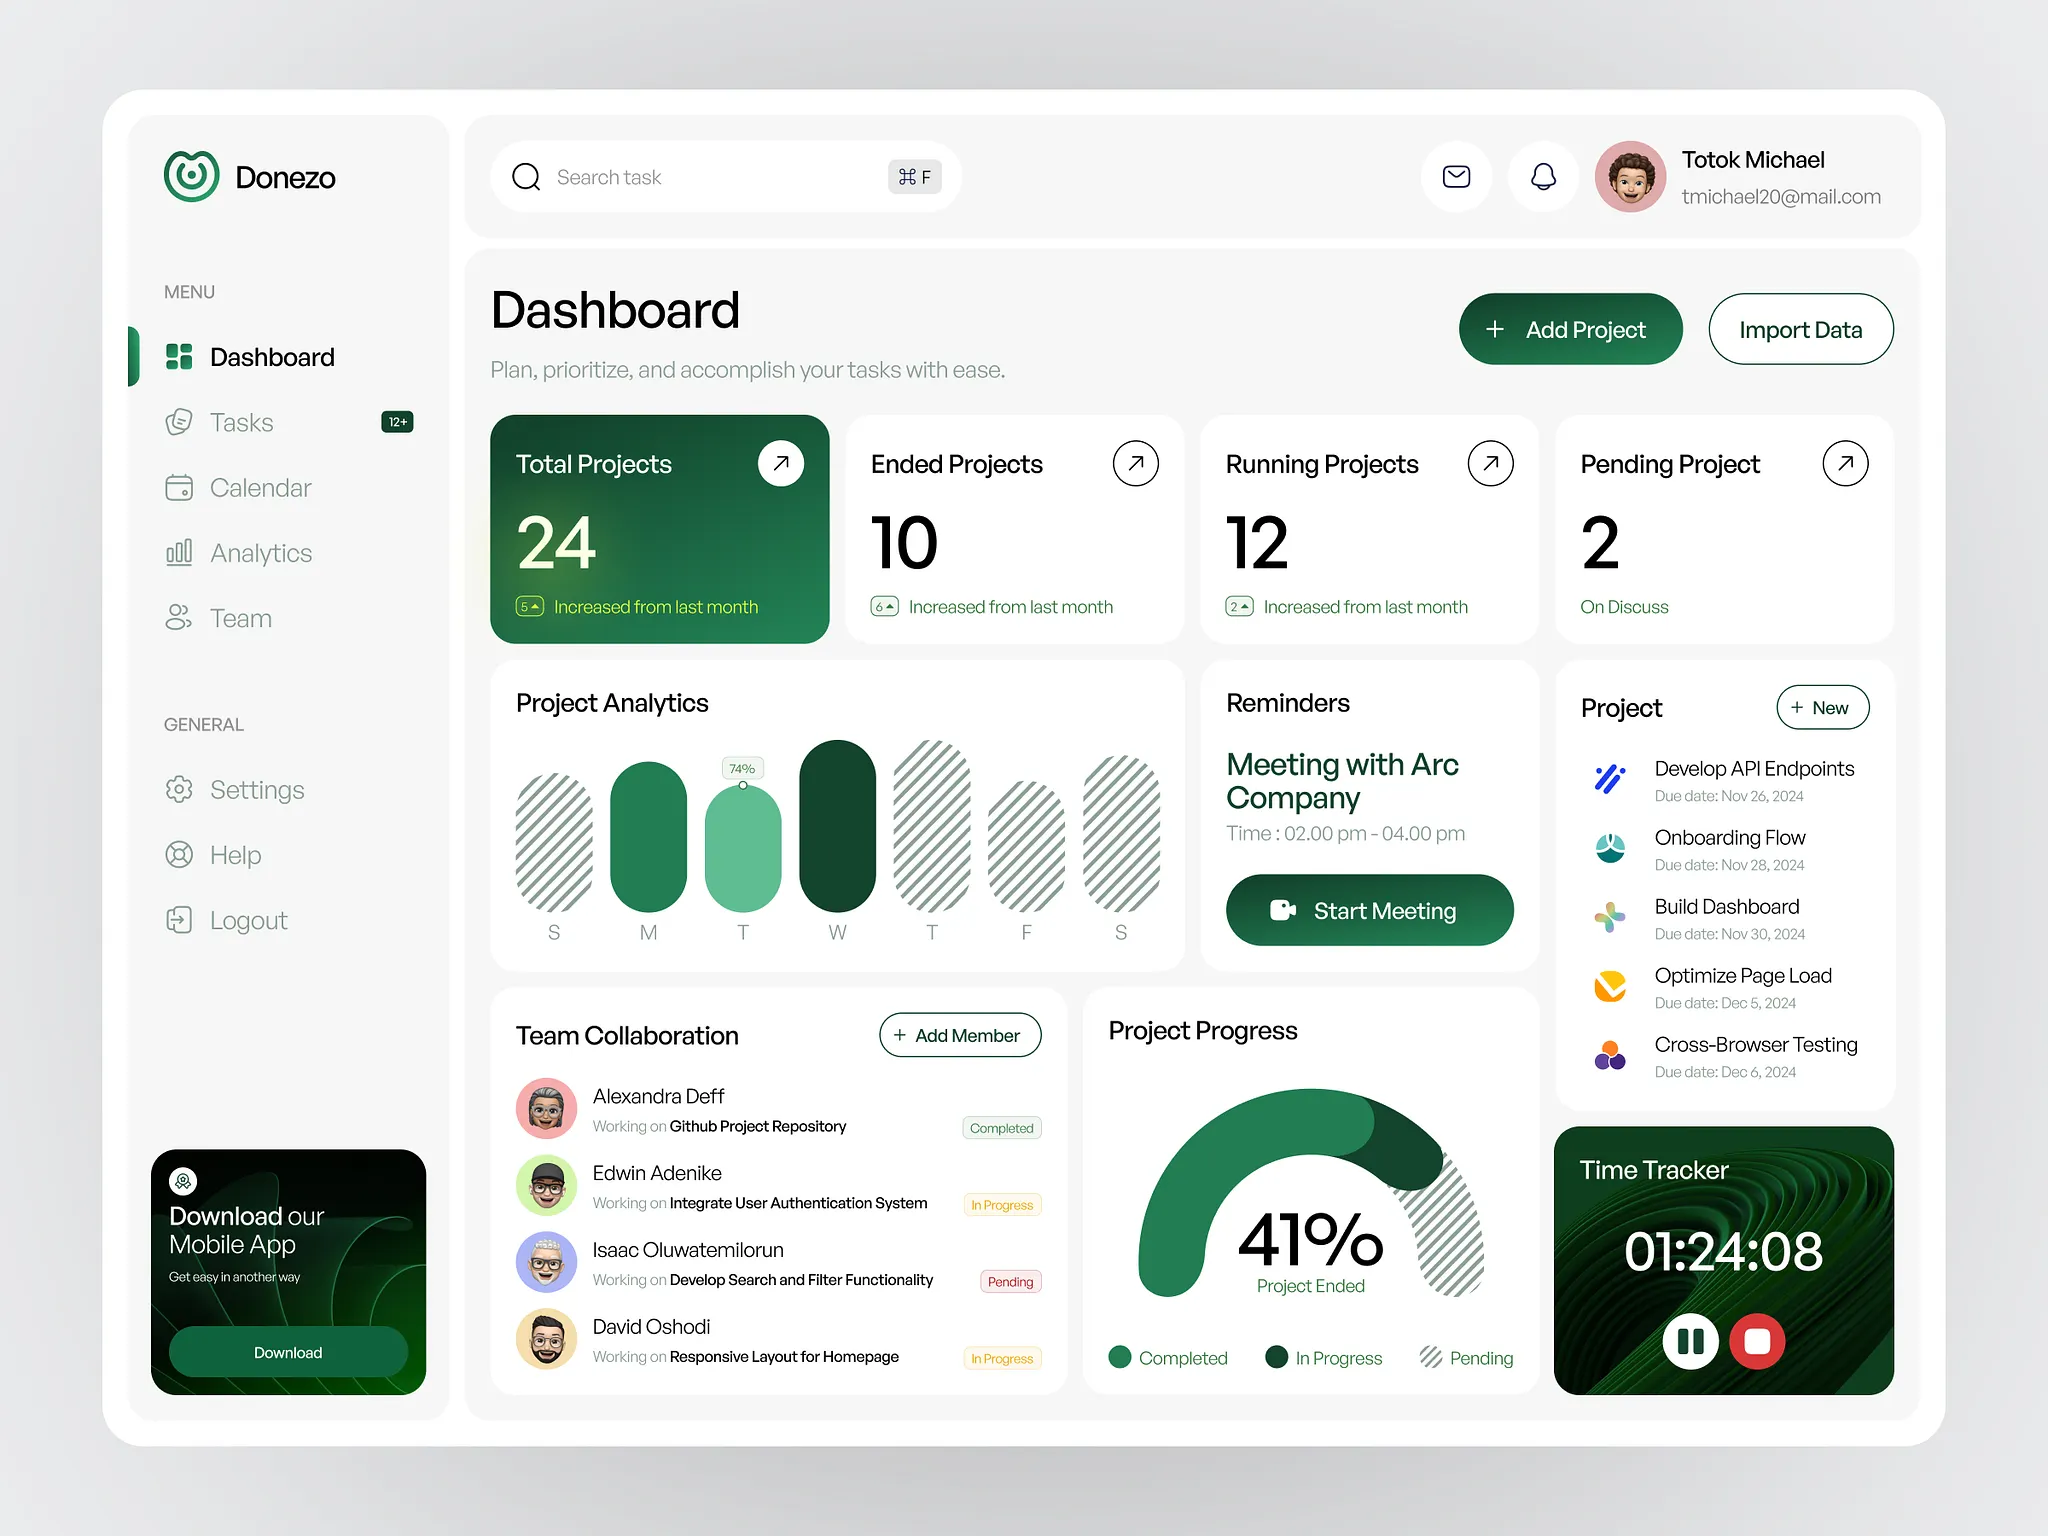
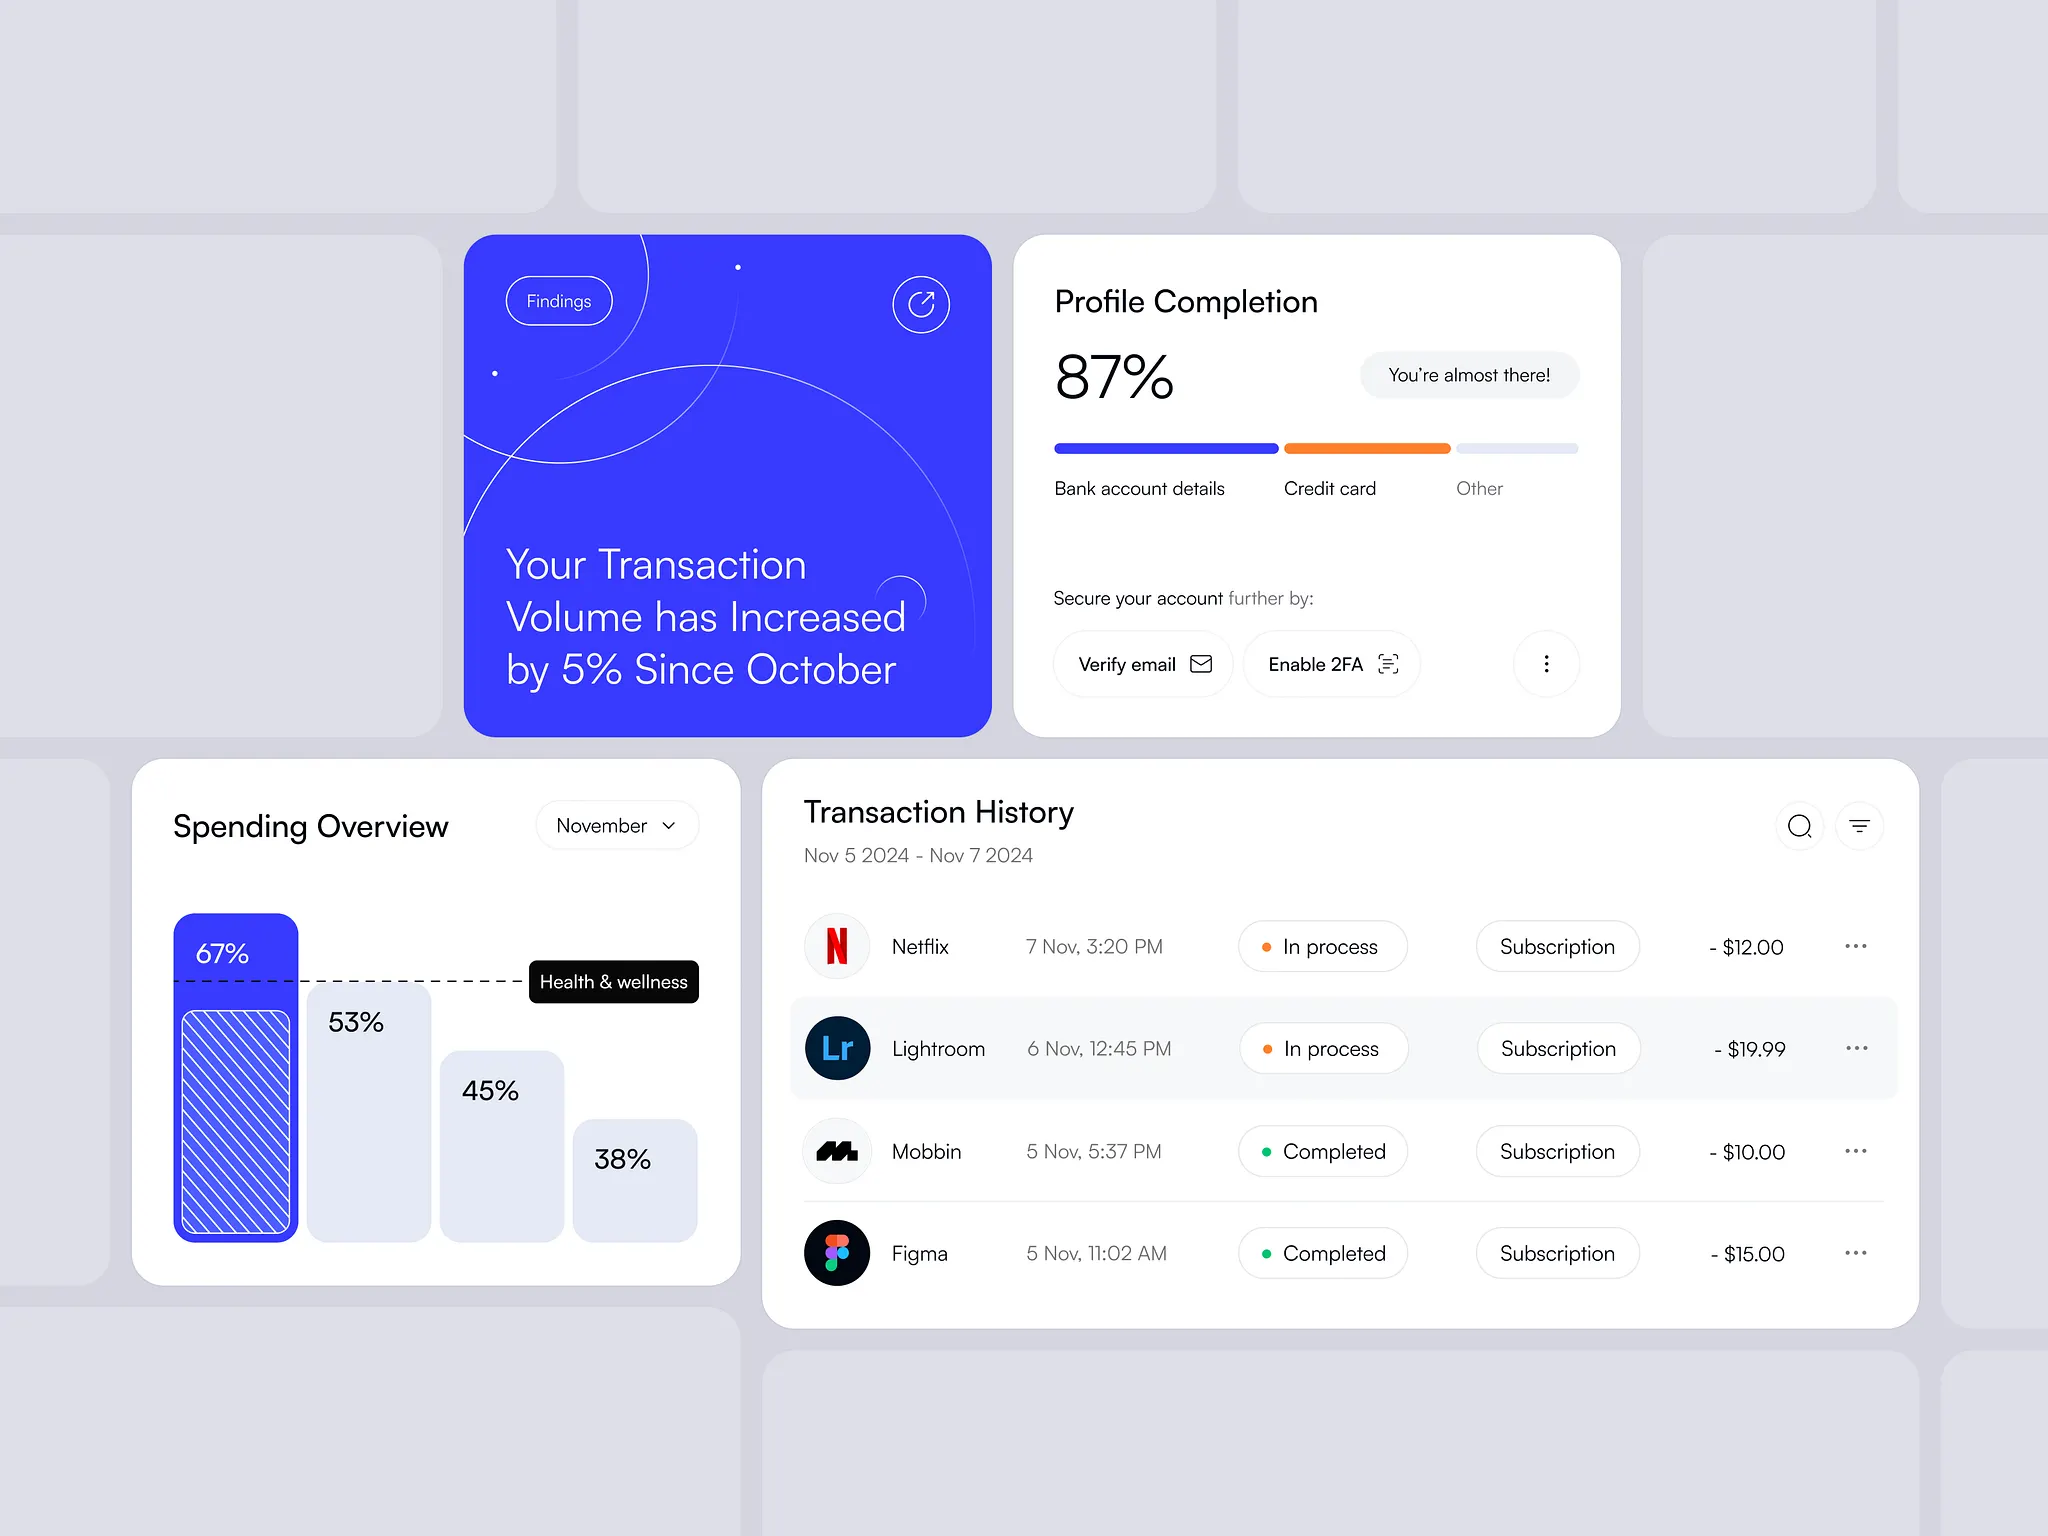
Design Exploration


I am here ready to help you in making creative digital products
Hi, there!
Luxe is here to be your assistance
Let’s Discuss
Home
Service
Portofolio
How we works
Luxe





Product Designer
5 Years

2K+
Projects

4.8
Satisfaction

Branding
Lorem ipsum dolor sit amet, consectetur adipiscing elit.

UI/UX
Lorem ipsum dolor sit amet, consectetur adipiscing elit.

Product Design
Lorem ipsum dolor sit amet, consectetur adipiscing elit.
Our Service
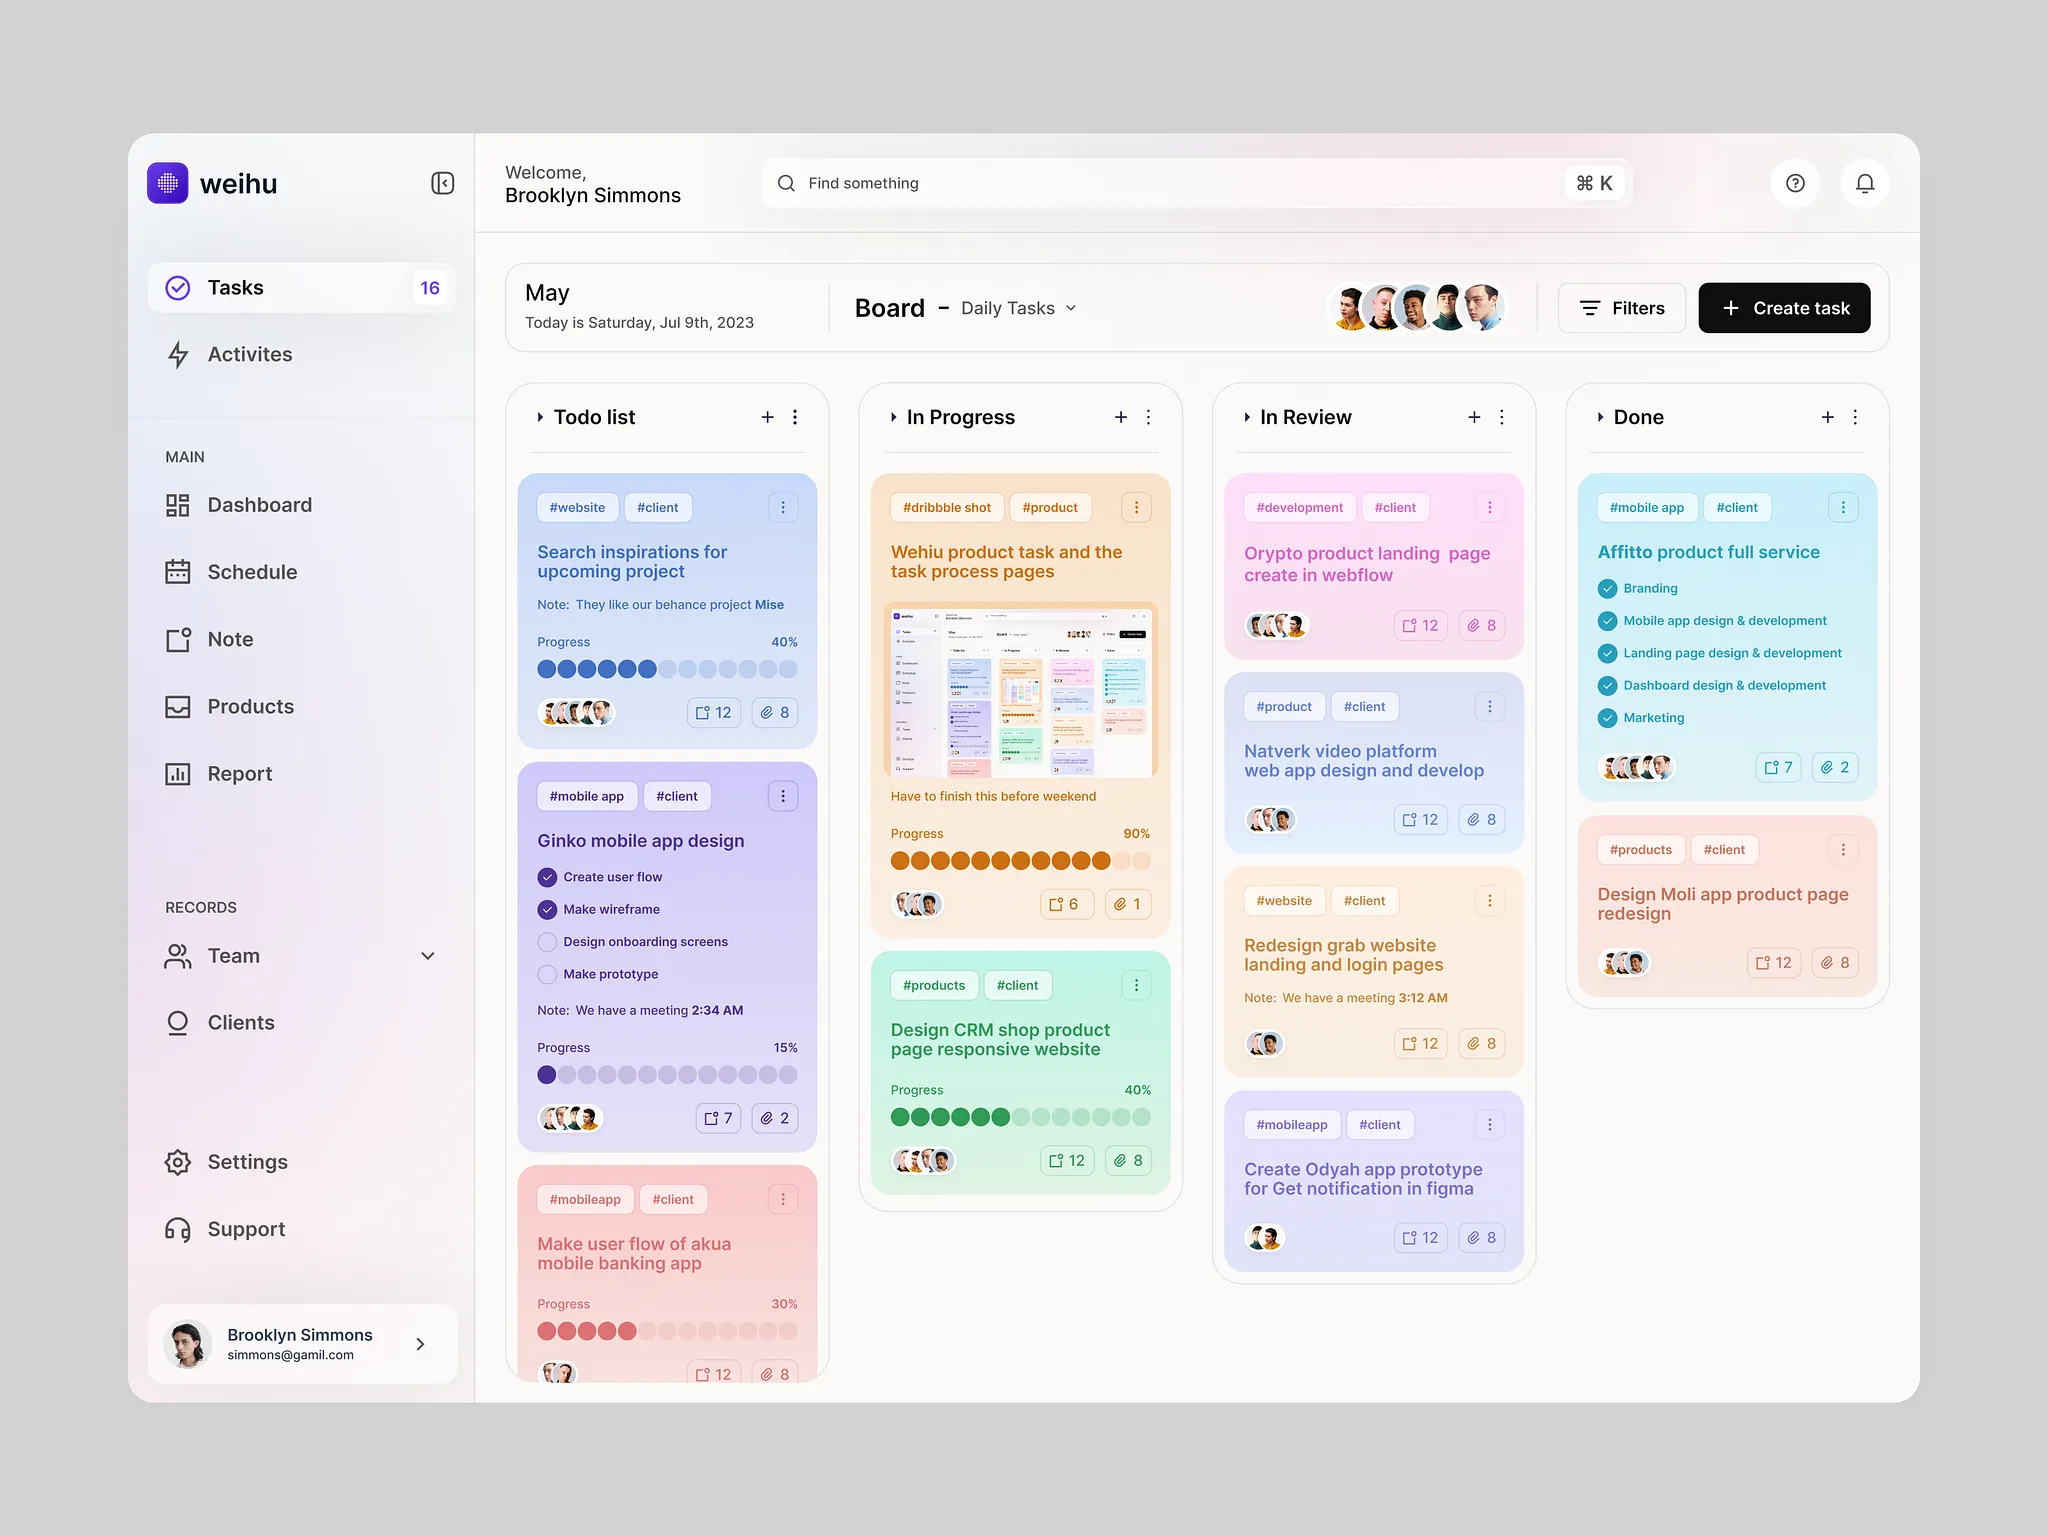
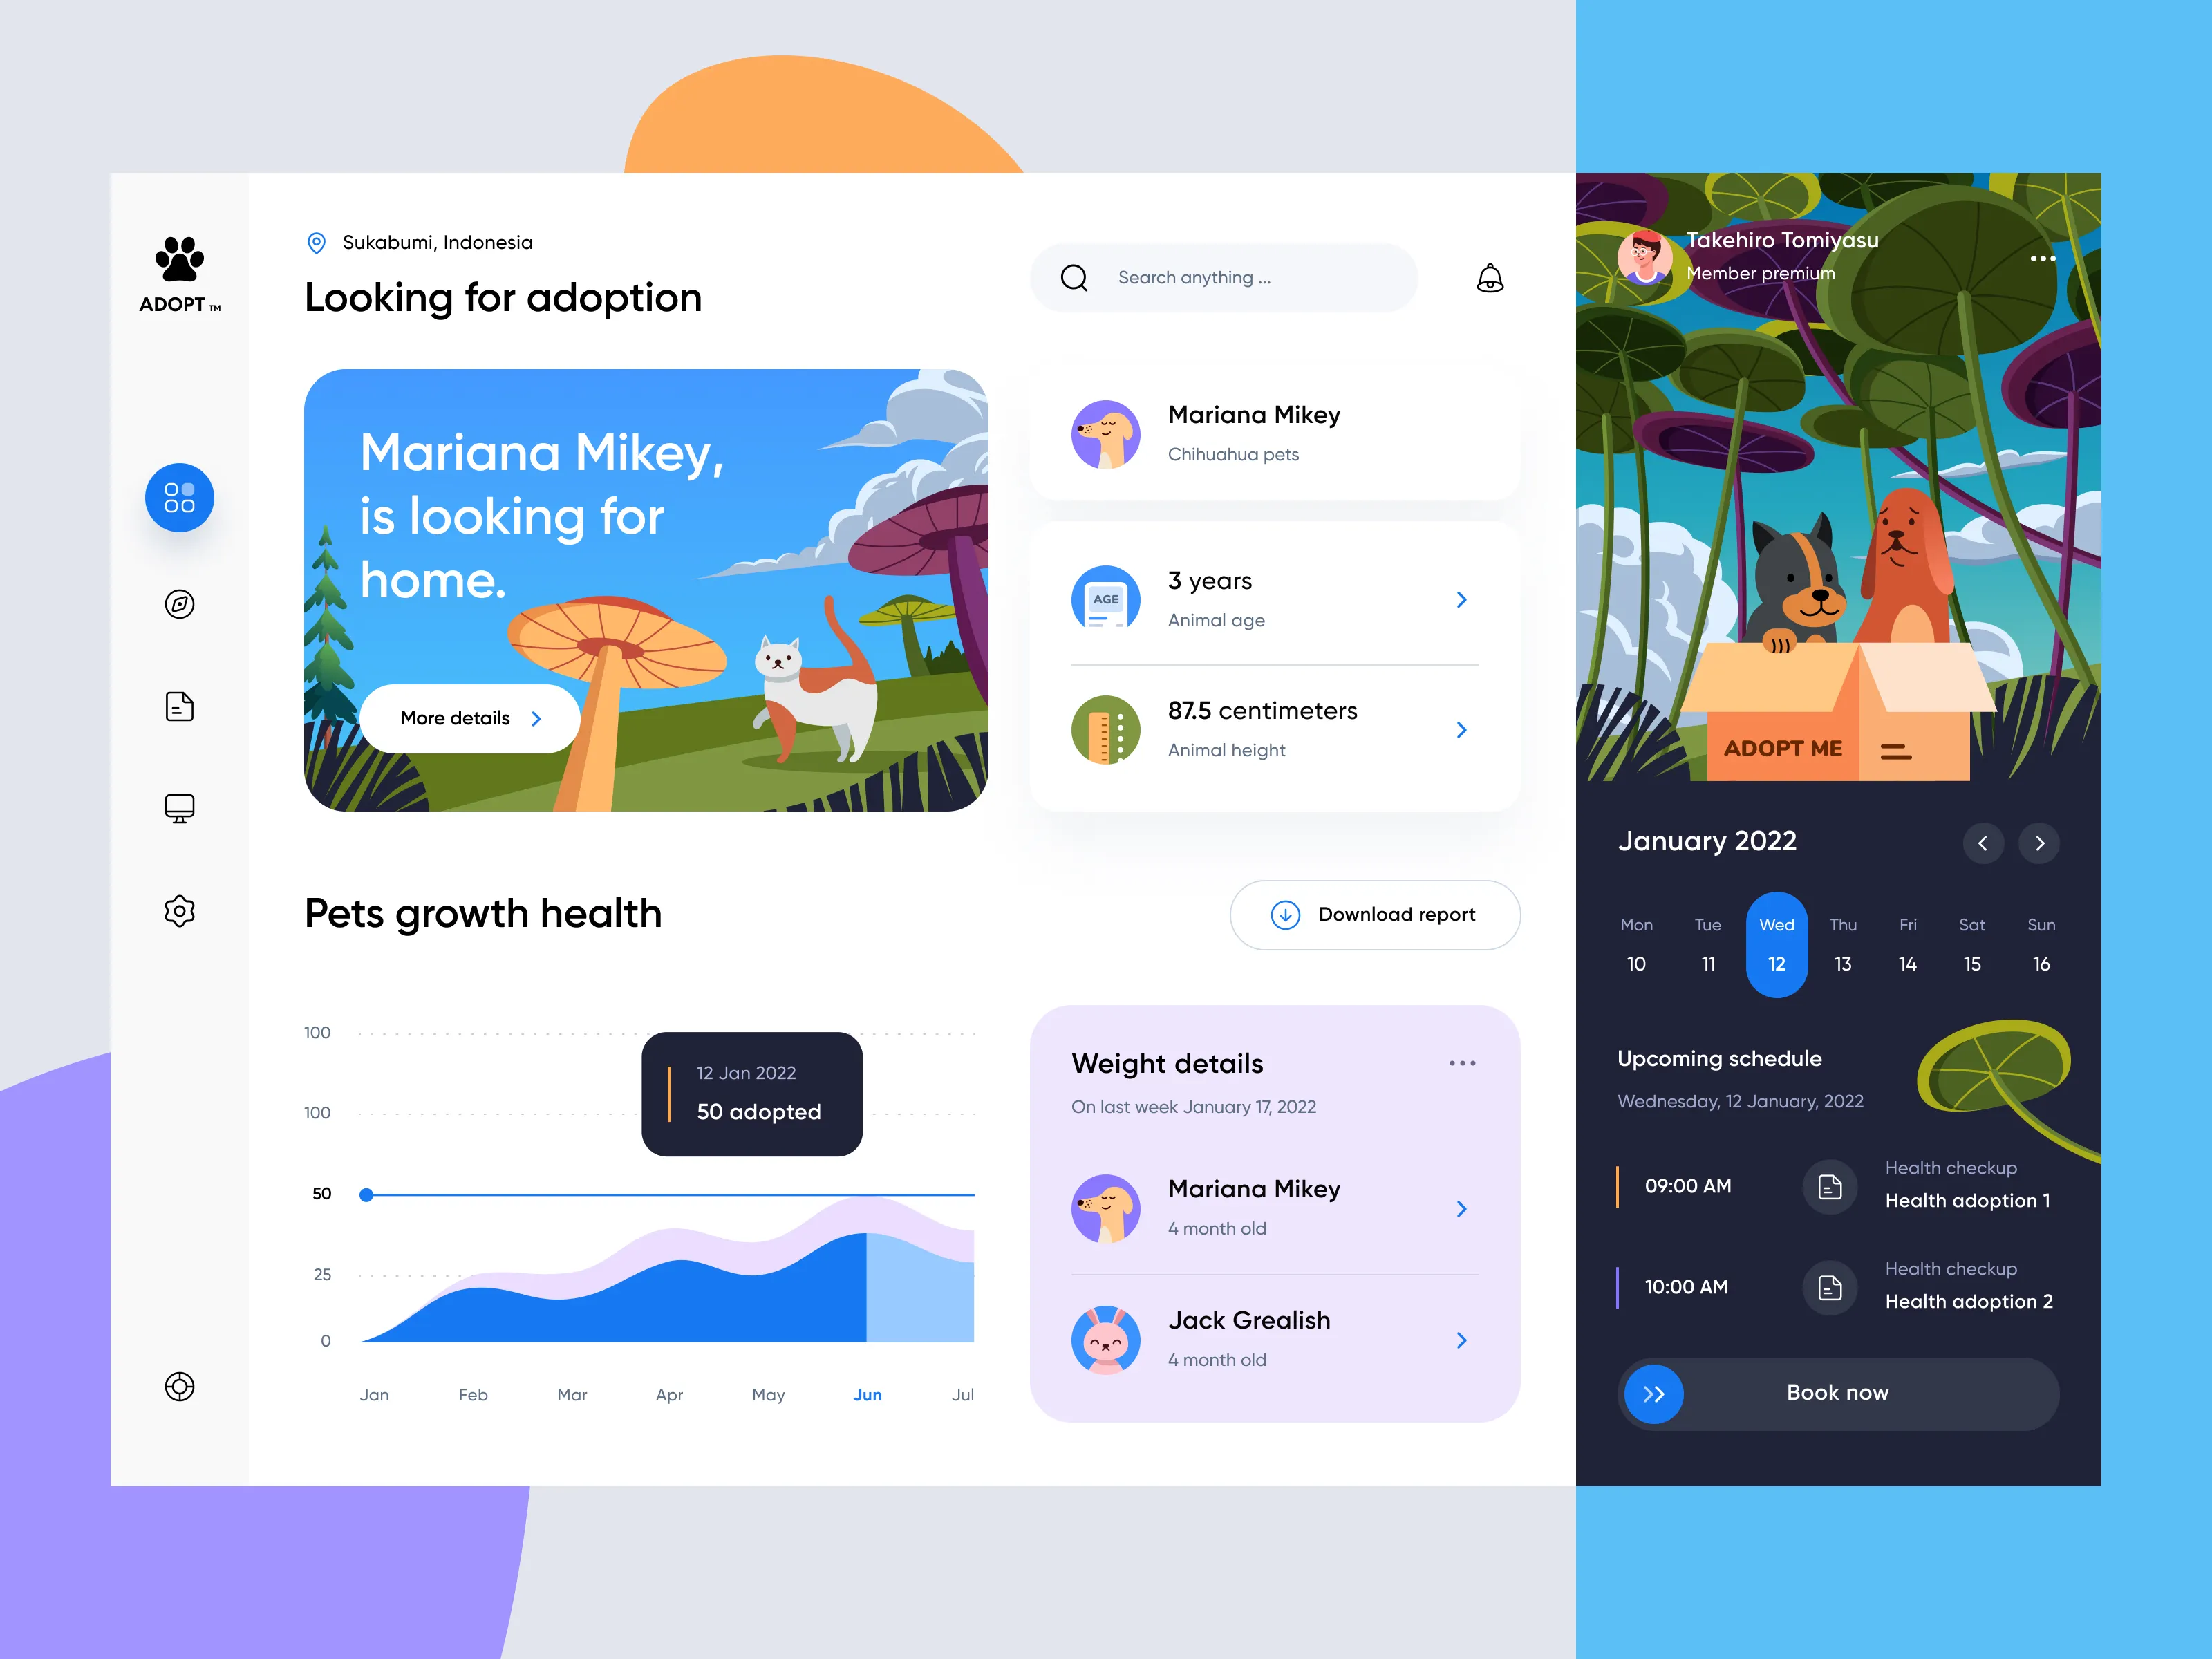
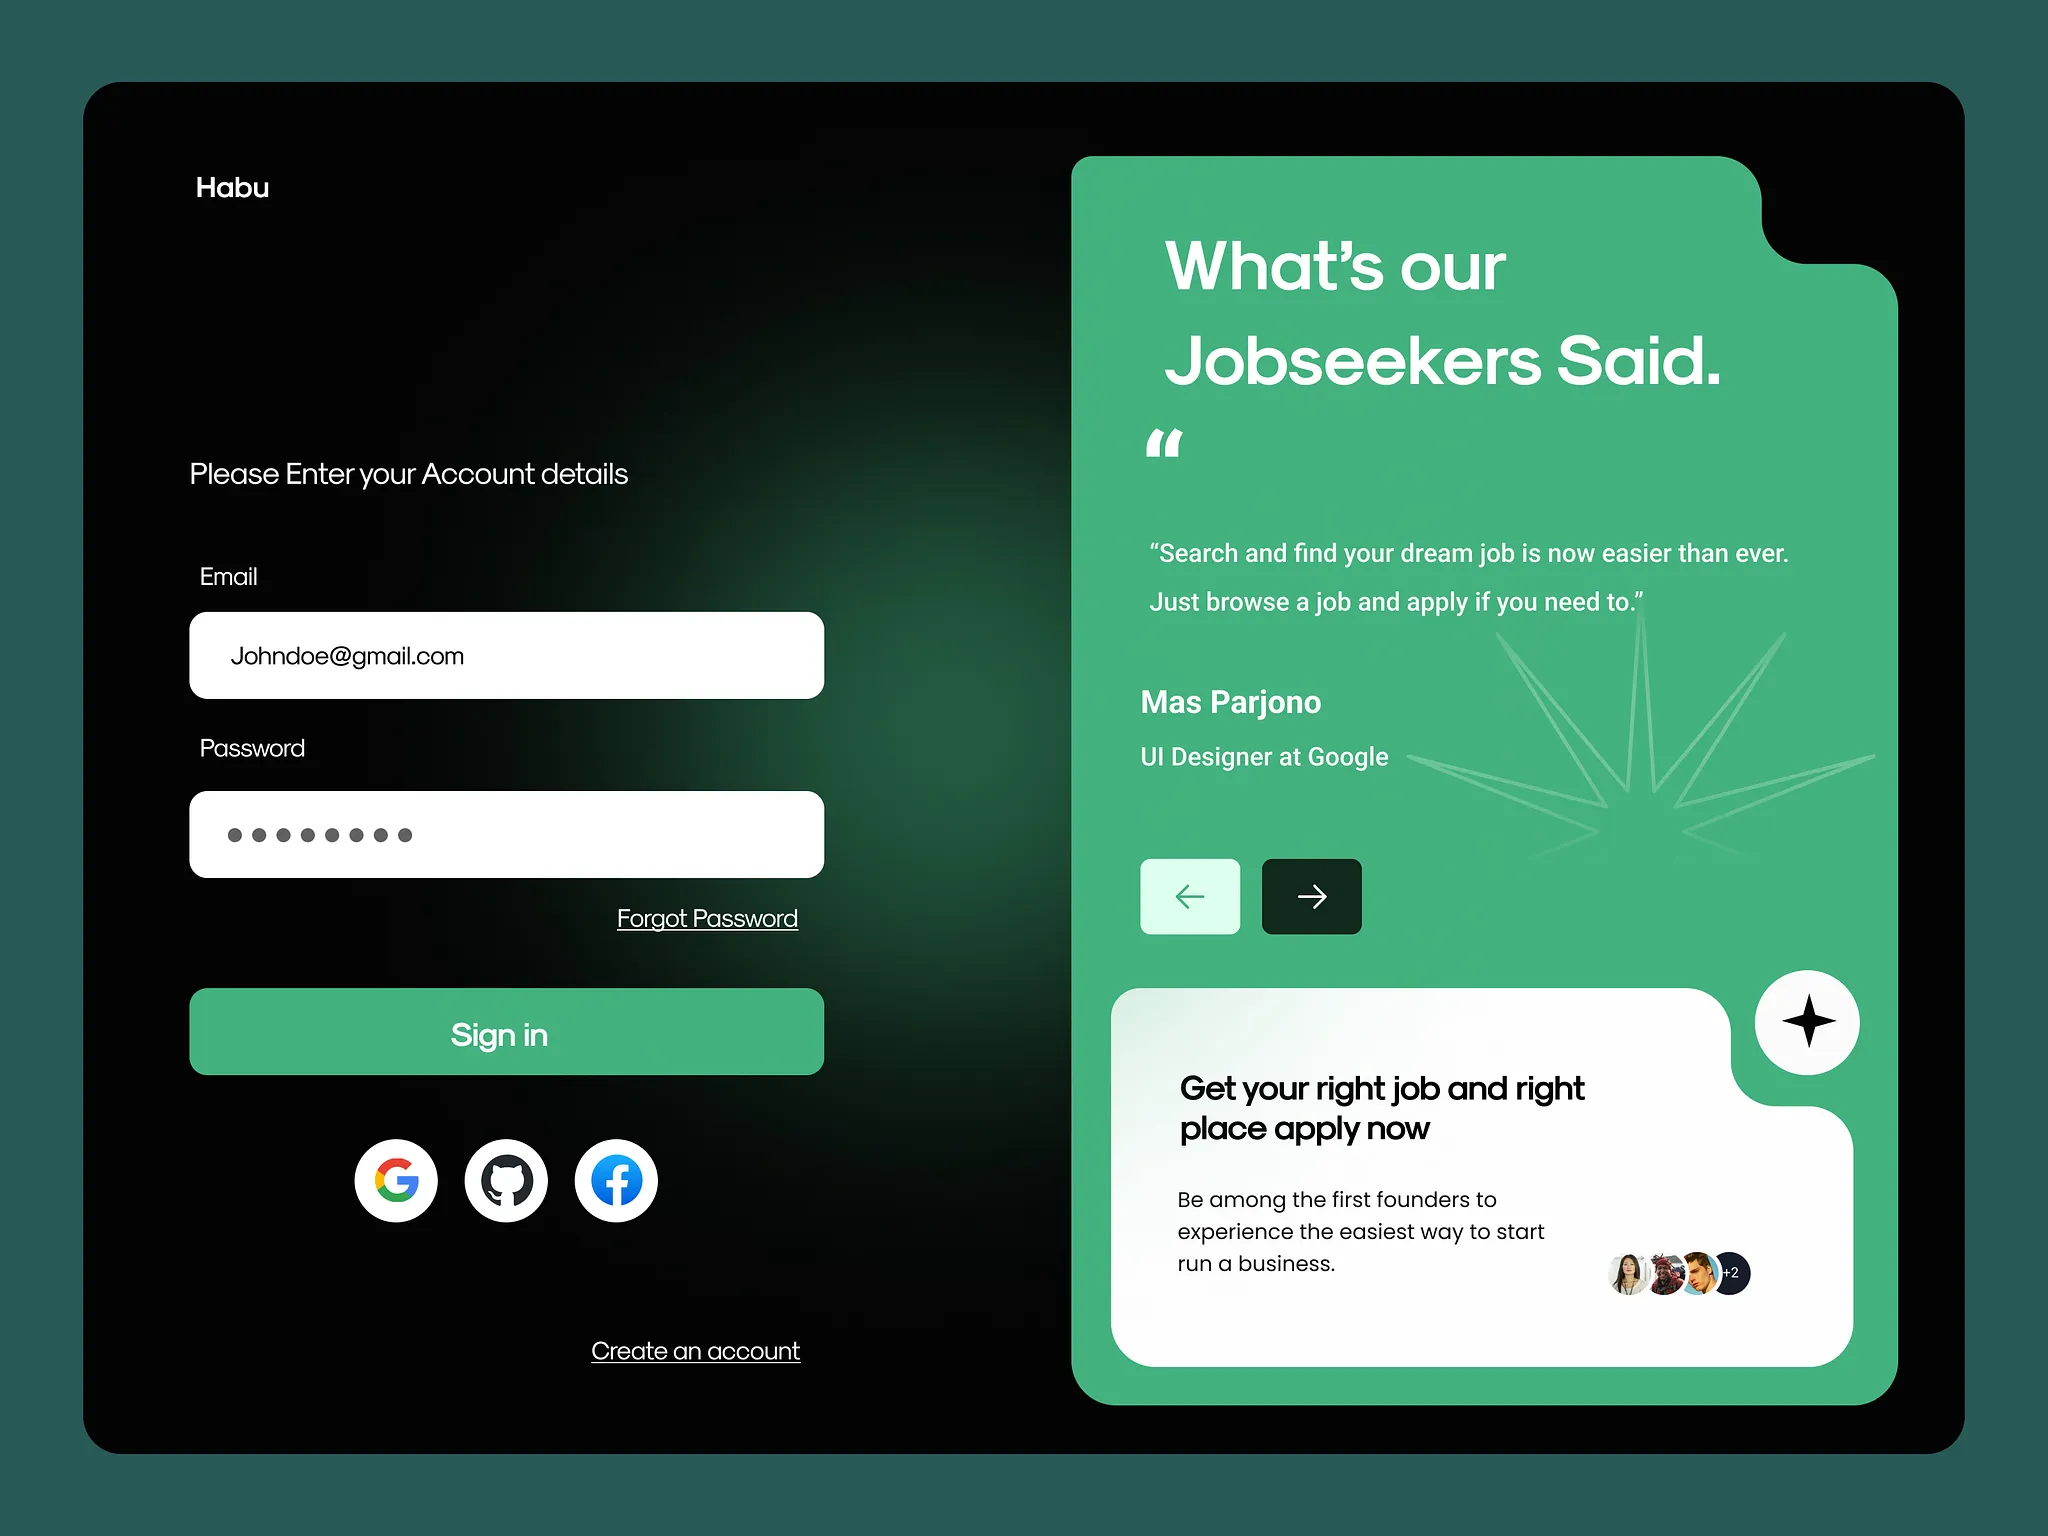
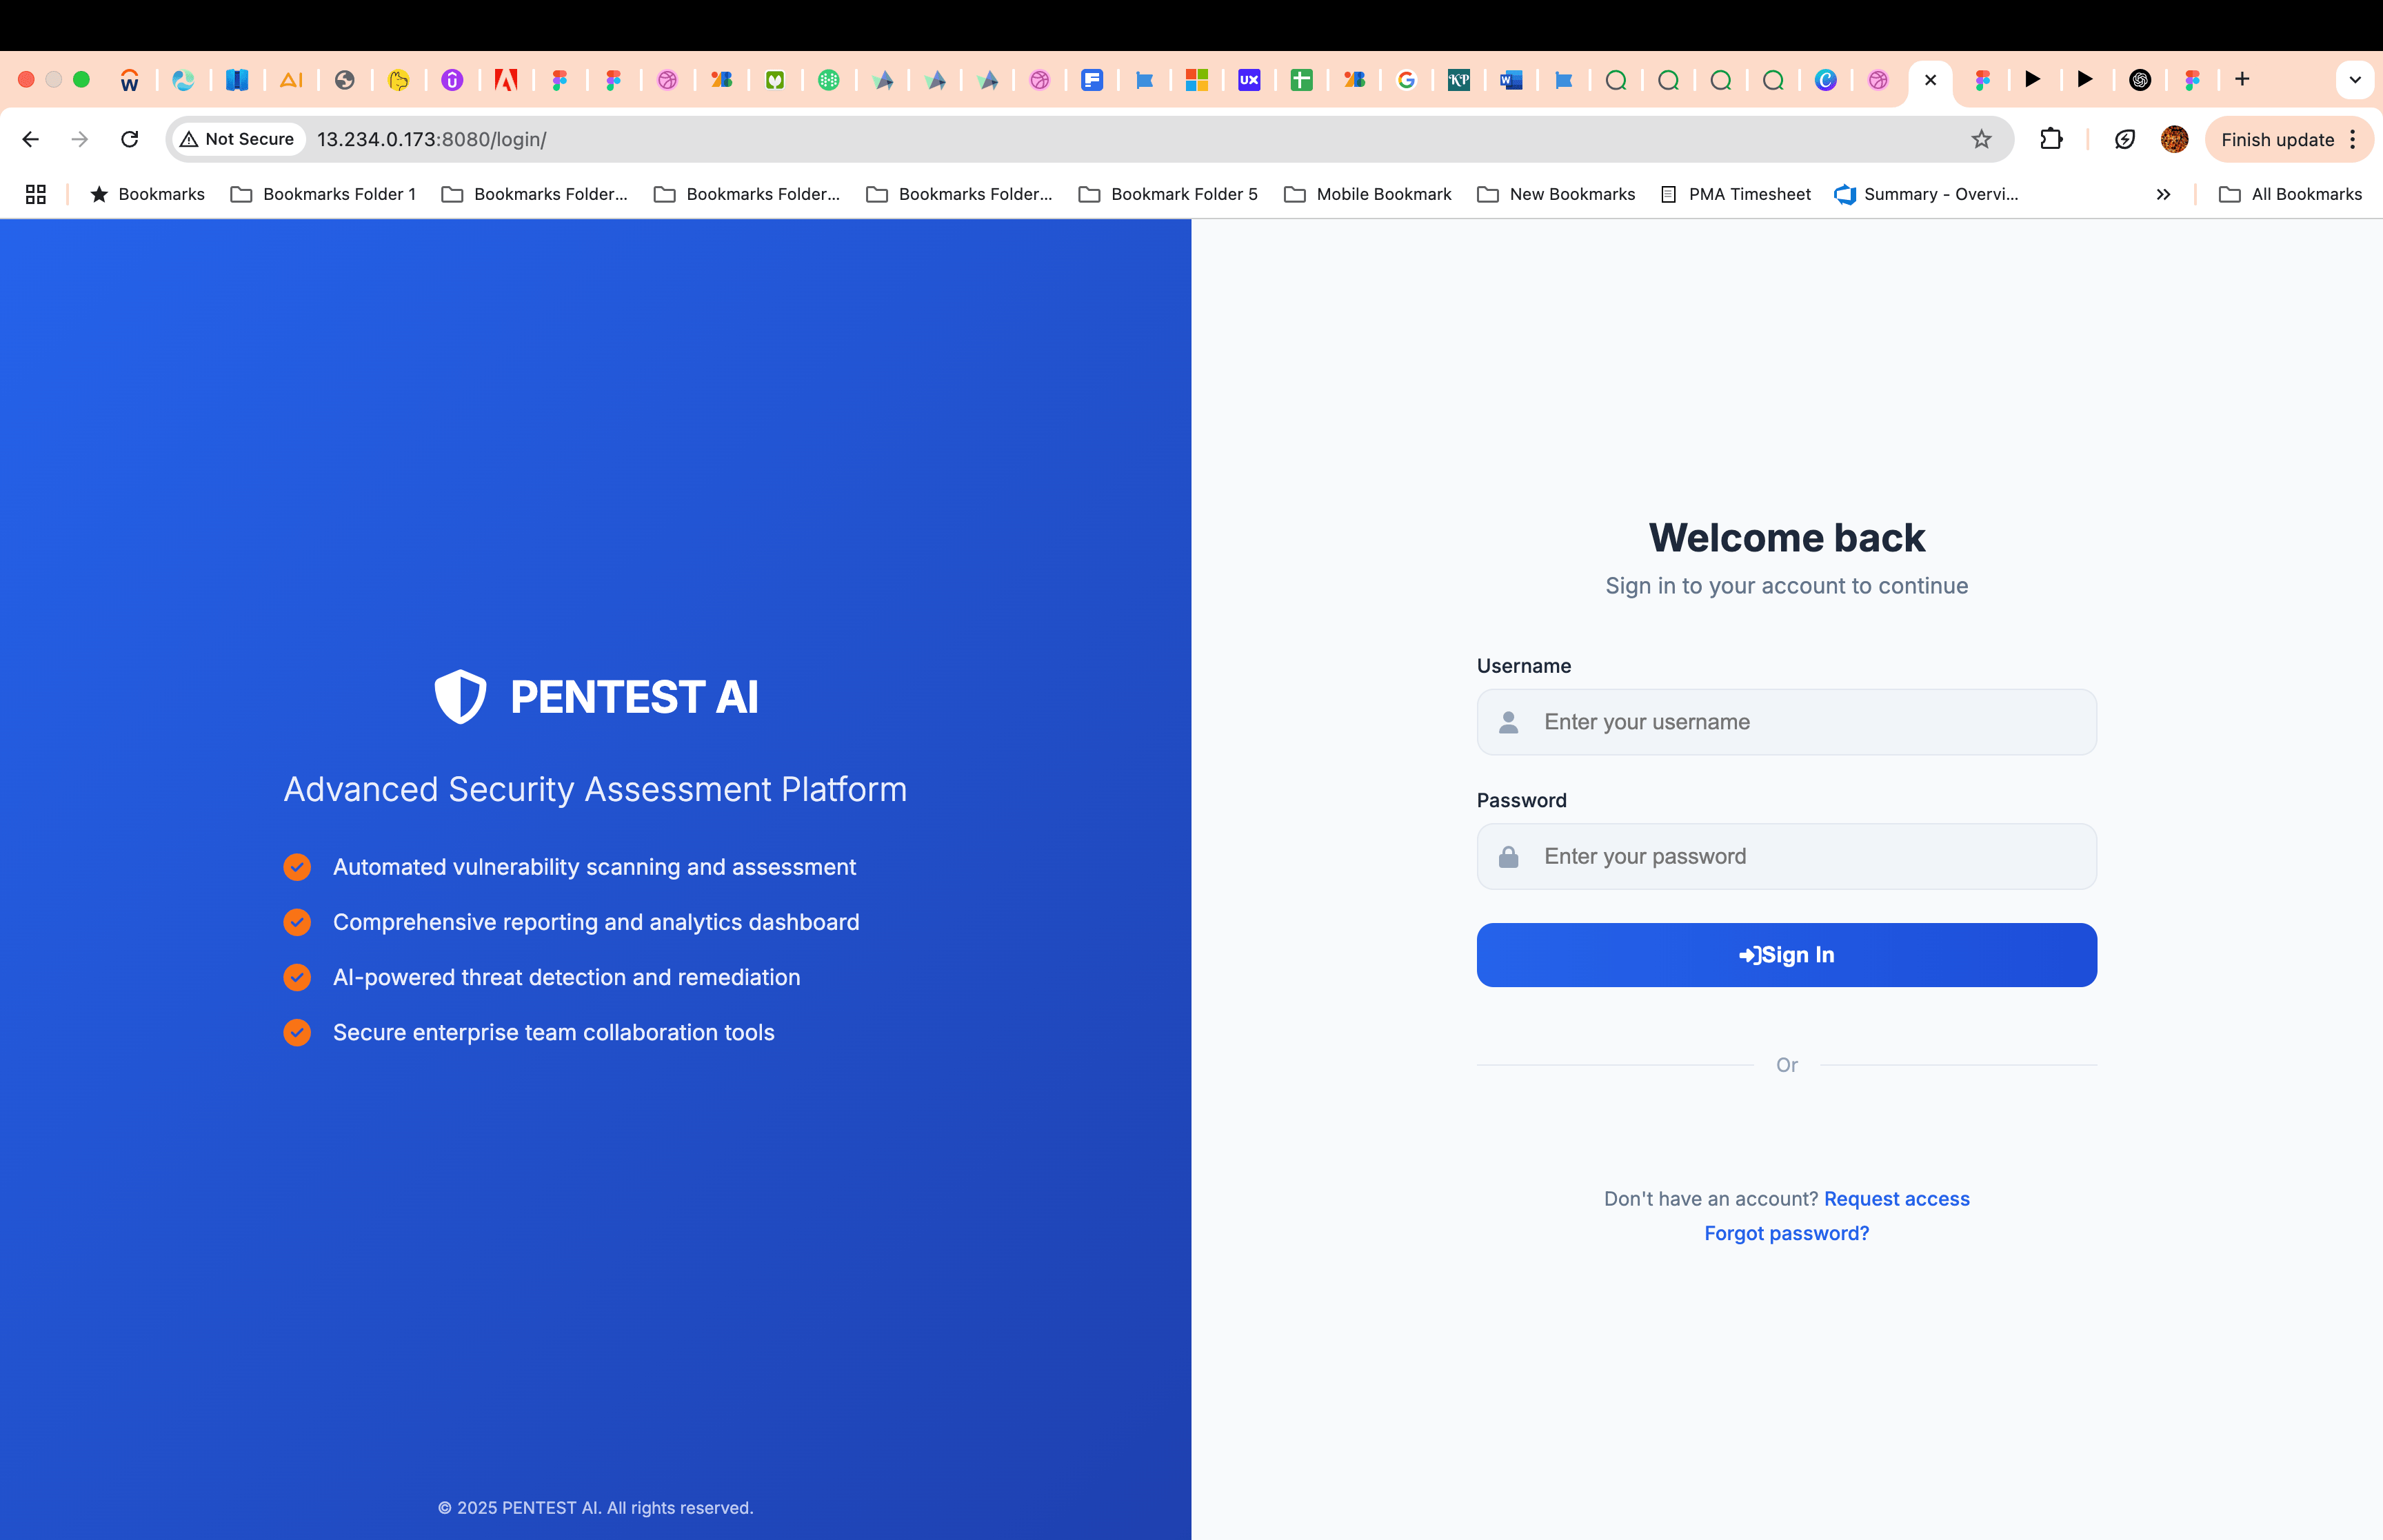
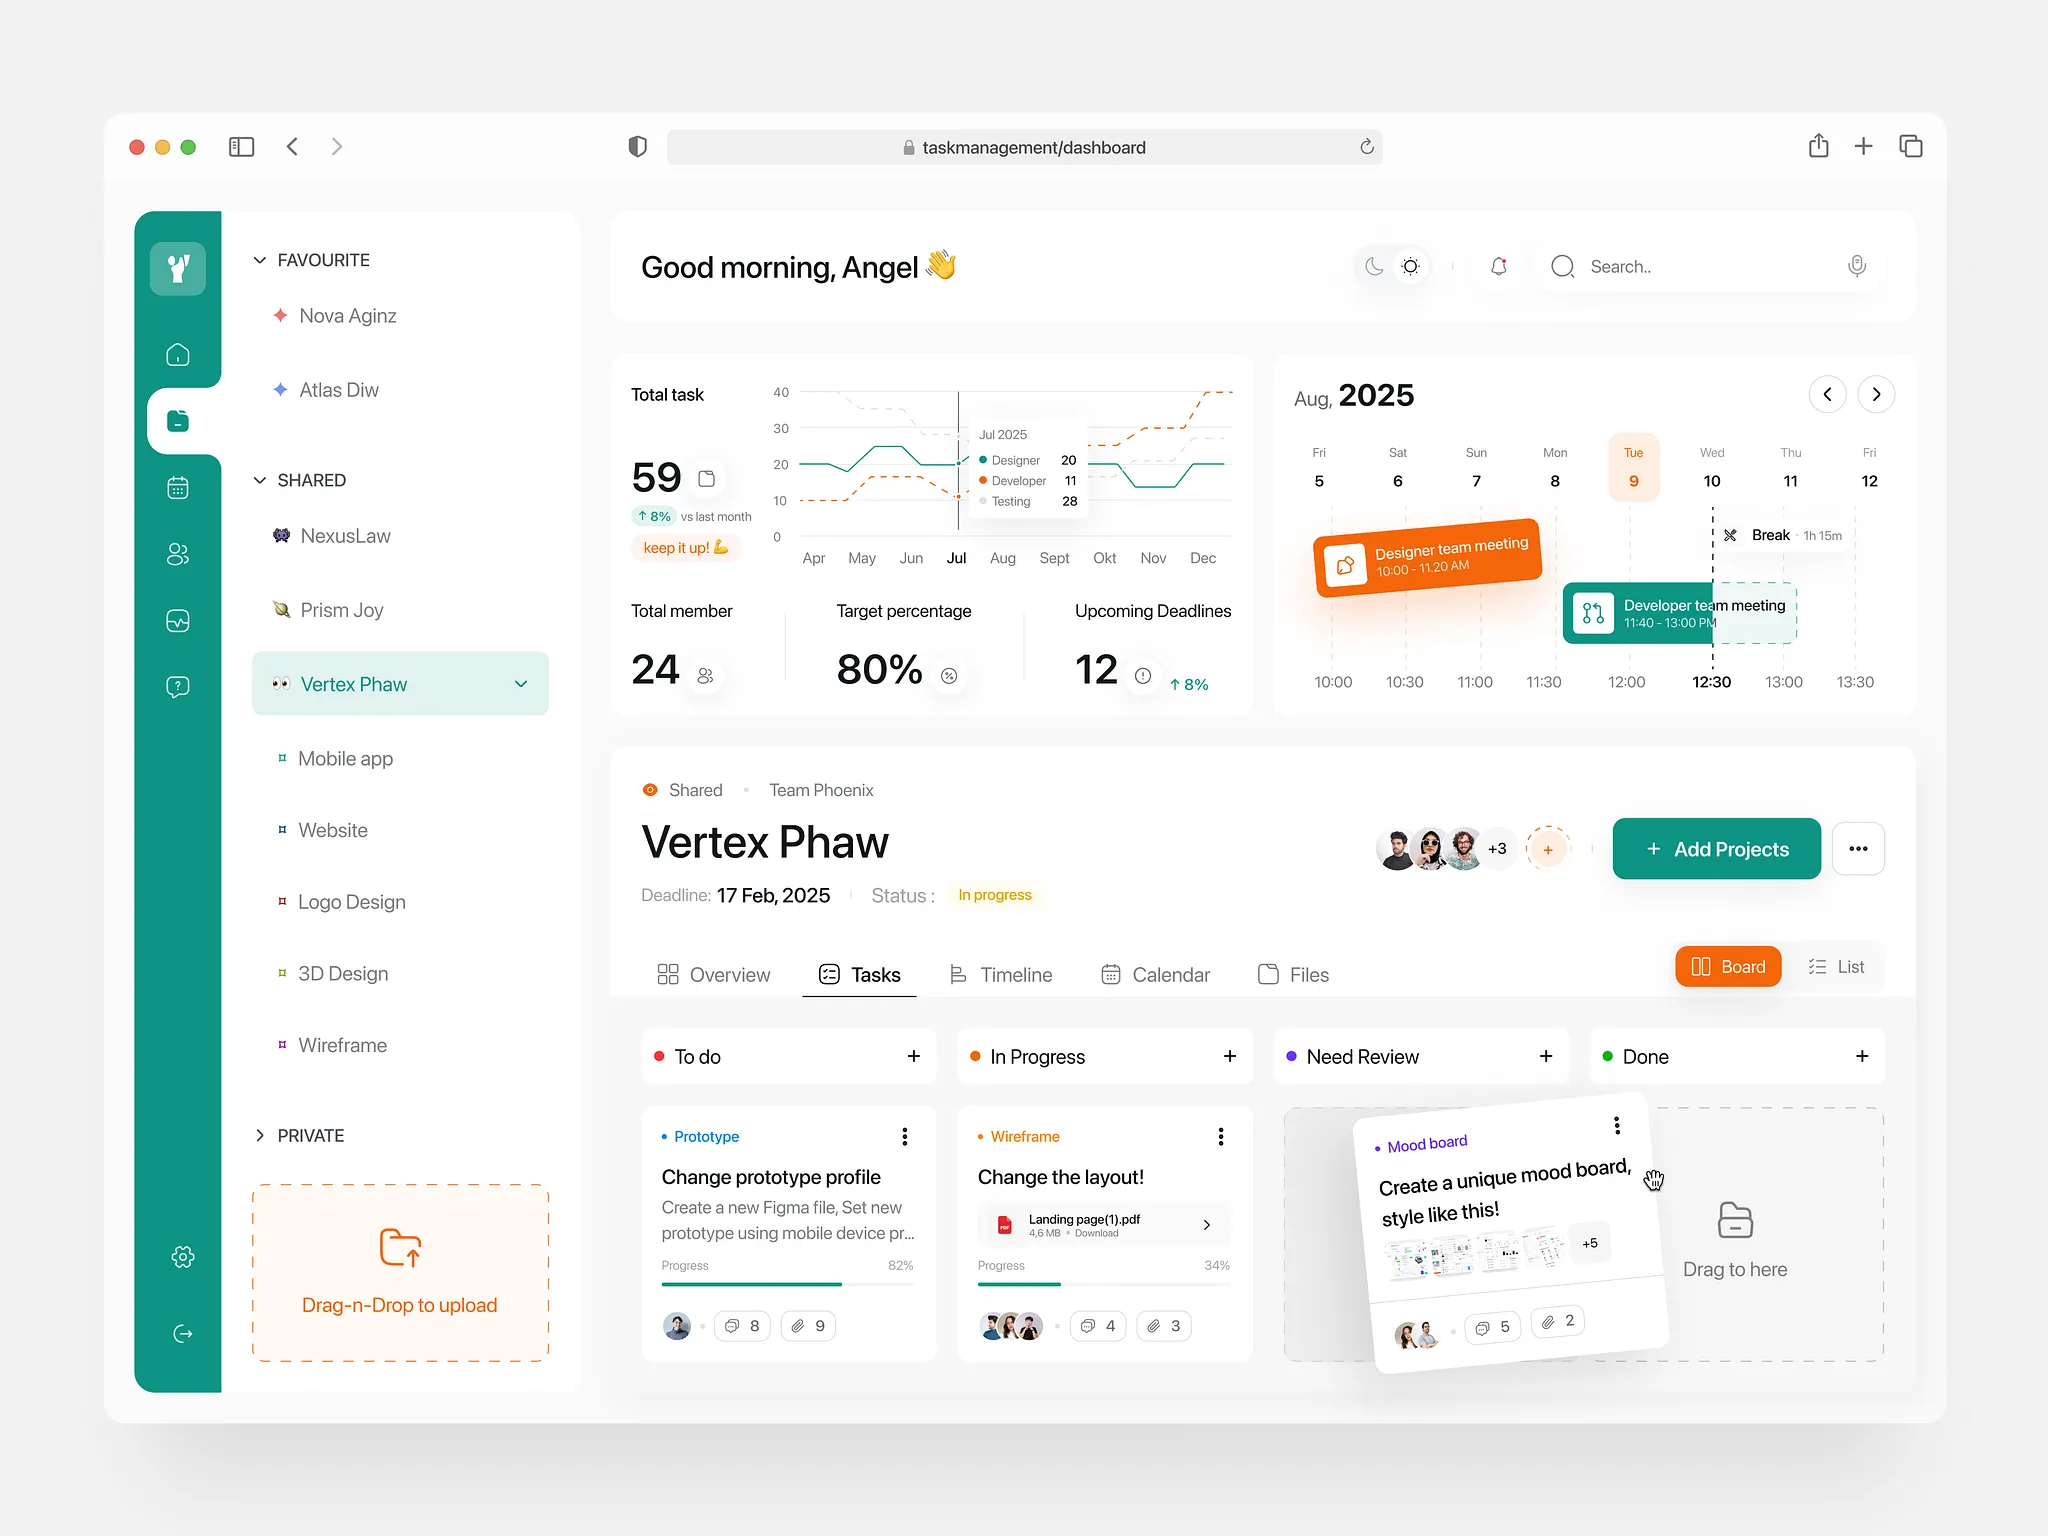
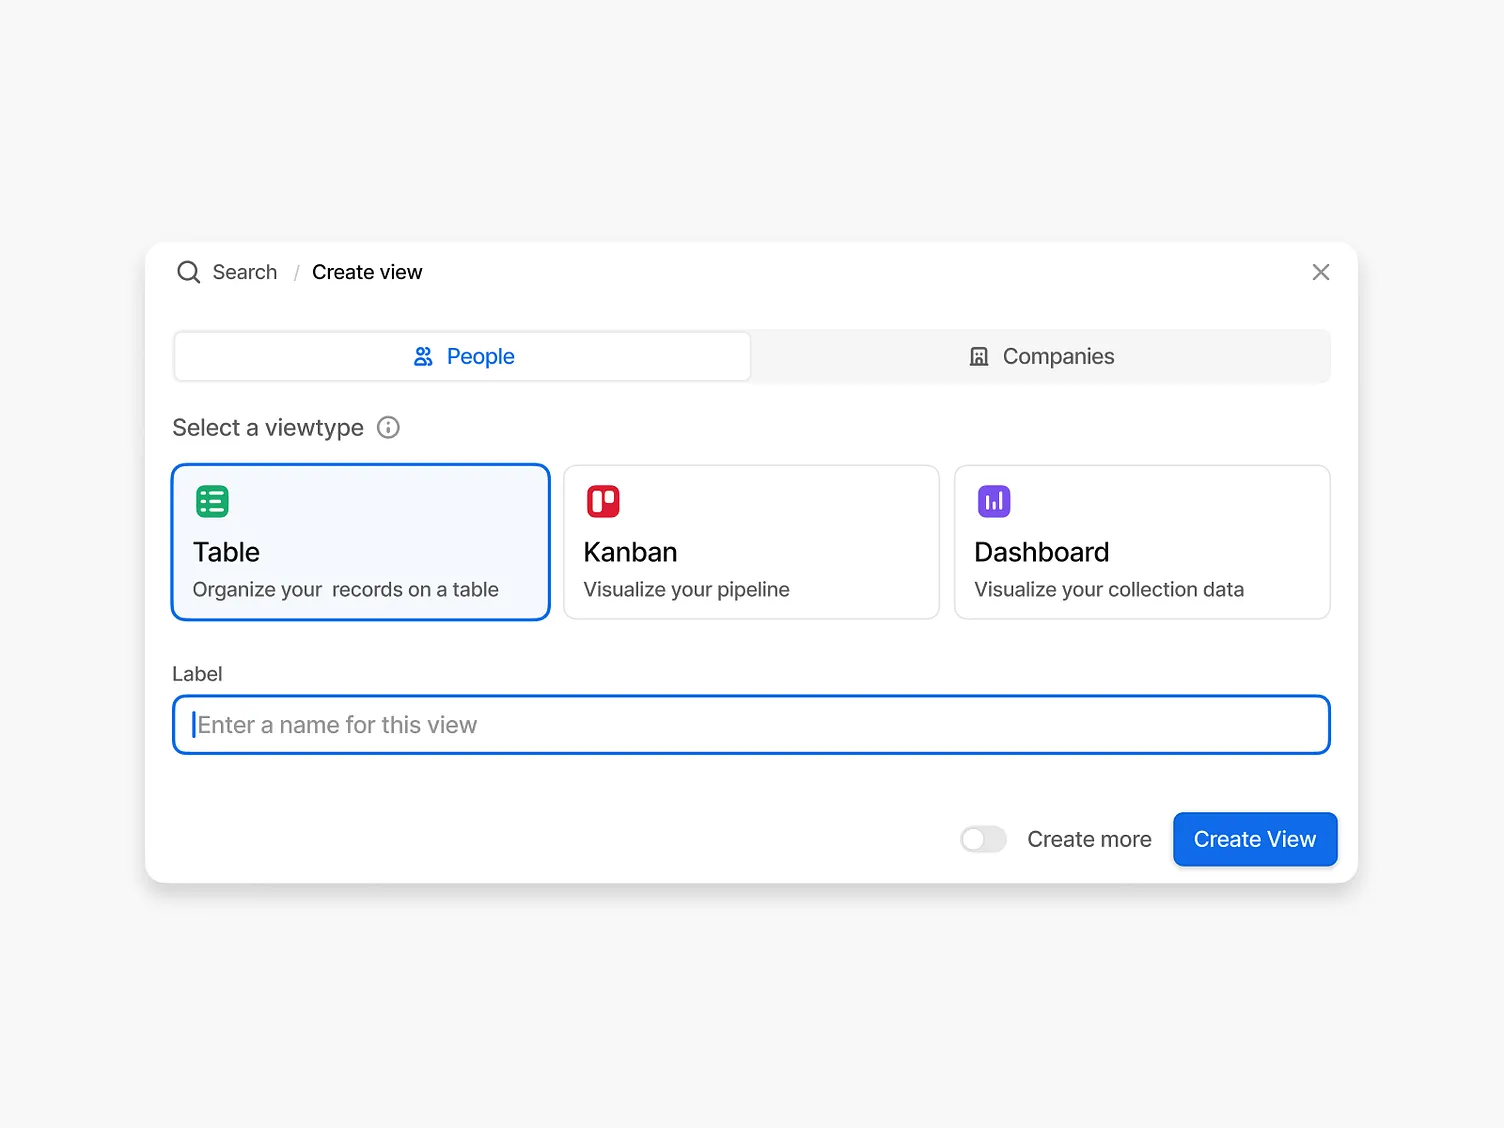
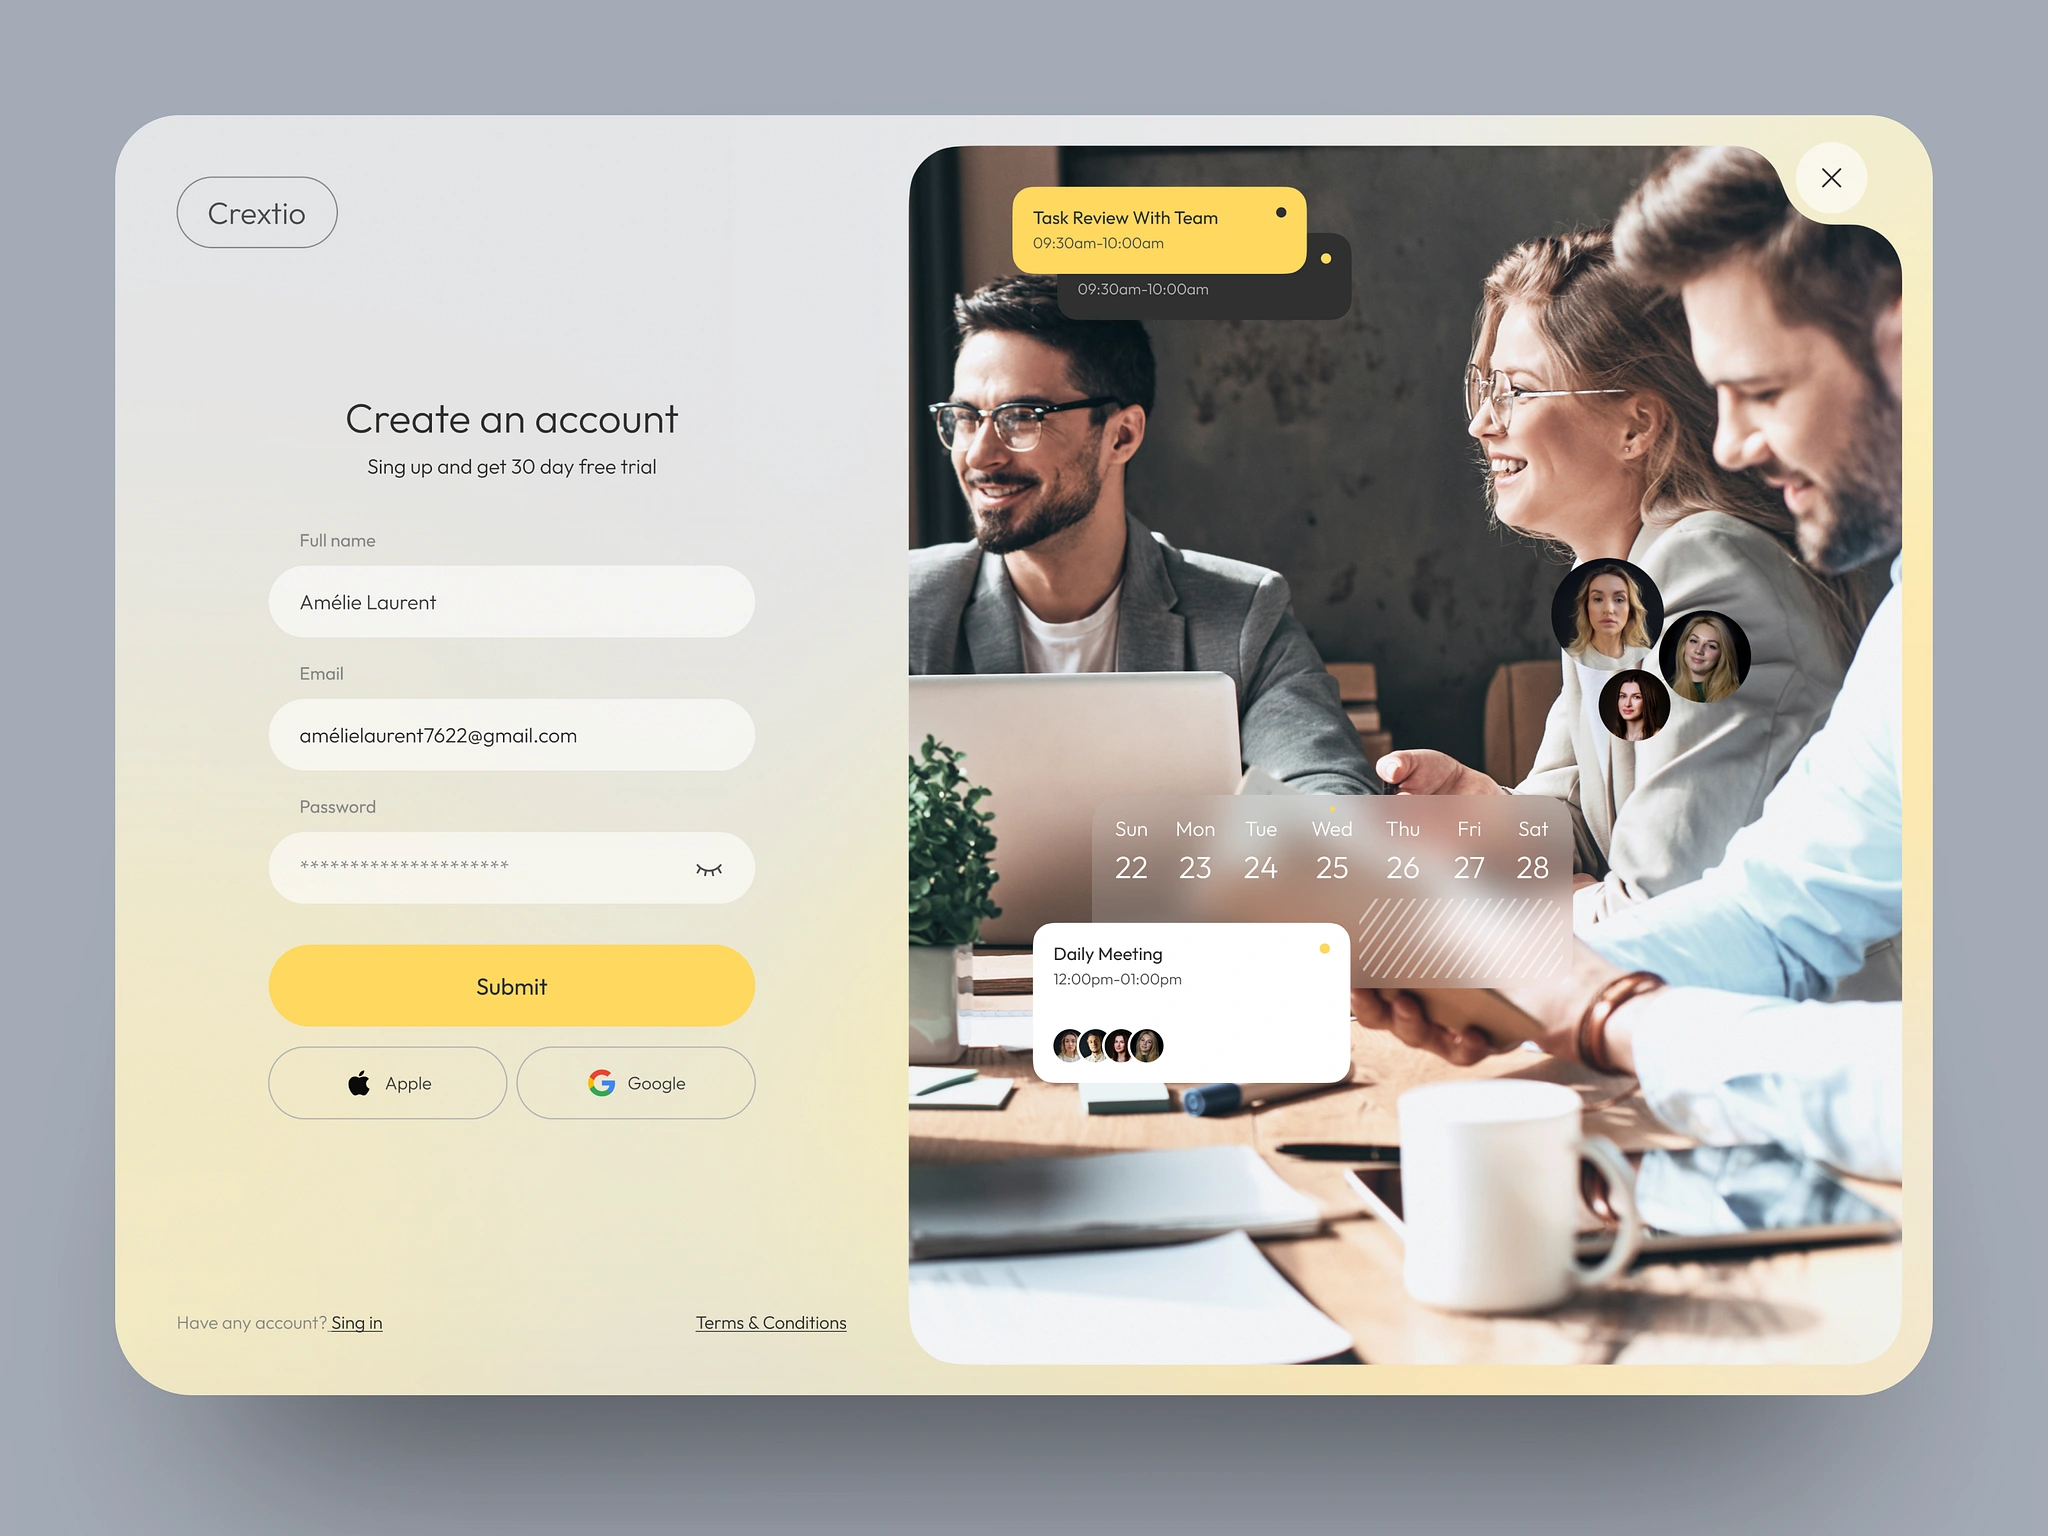
Creativity Exploration Resources
Creativity Exploration Resources:
Color Palettes (Canva.com, Coolors.co , Adobe Color)
Brand Inspiration (Behance , Dribbble)
Content Inspiration (Pinterest , YouTube)
Ad Inspiration (Rich Media Gallery , Ads of the World)
Product Inspiration (Yanko Design , Awwwards , Mobbin)
Everyday Inspiration (Art Galleries, Photography, Nature, Literature)
Moodboard - Gen AI Led Risk Assessment Accelerator
Moodboard - Gen AI Led Risk Assessment Accelerator
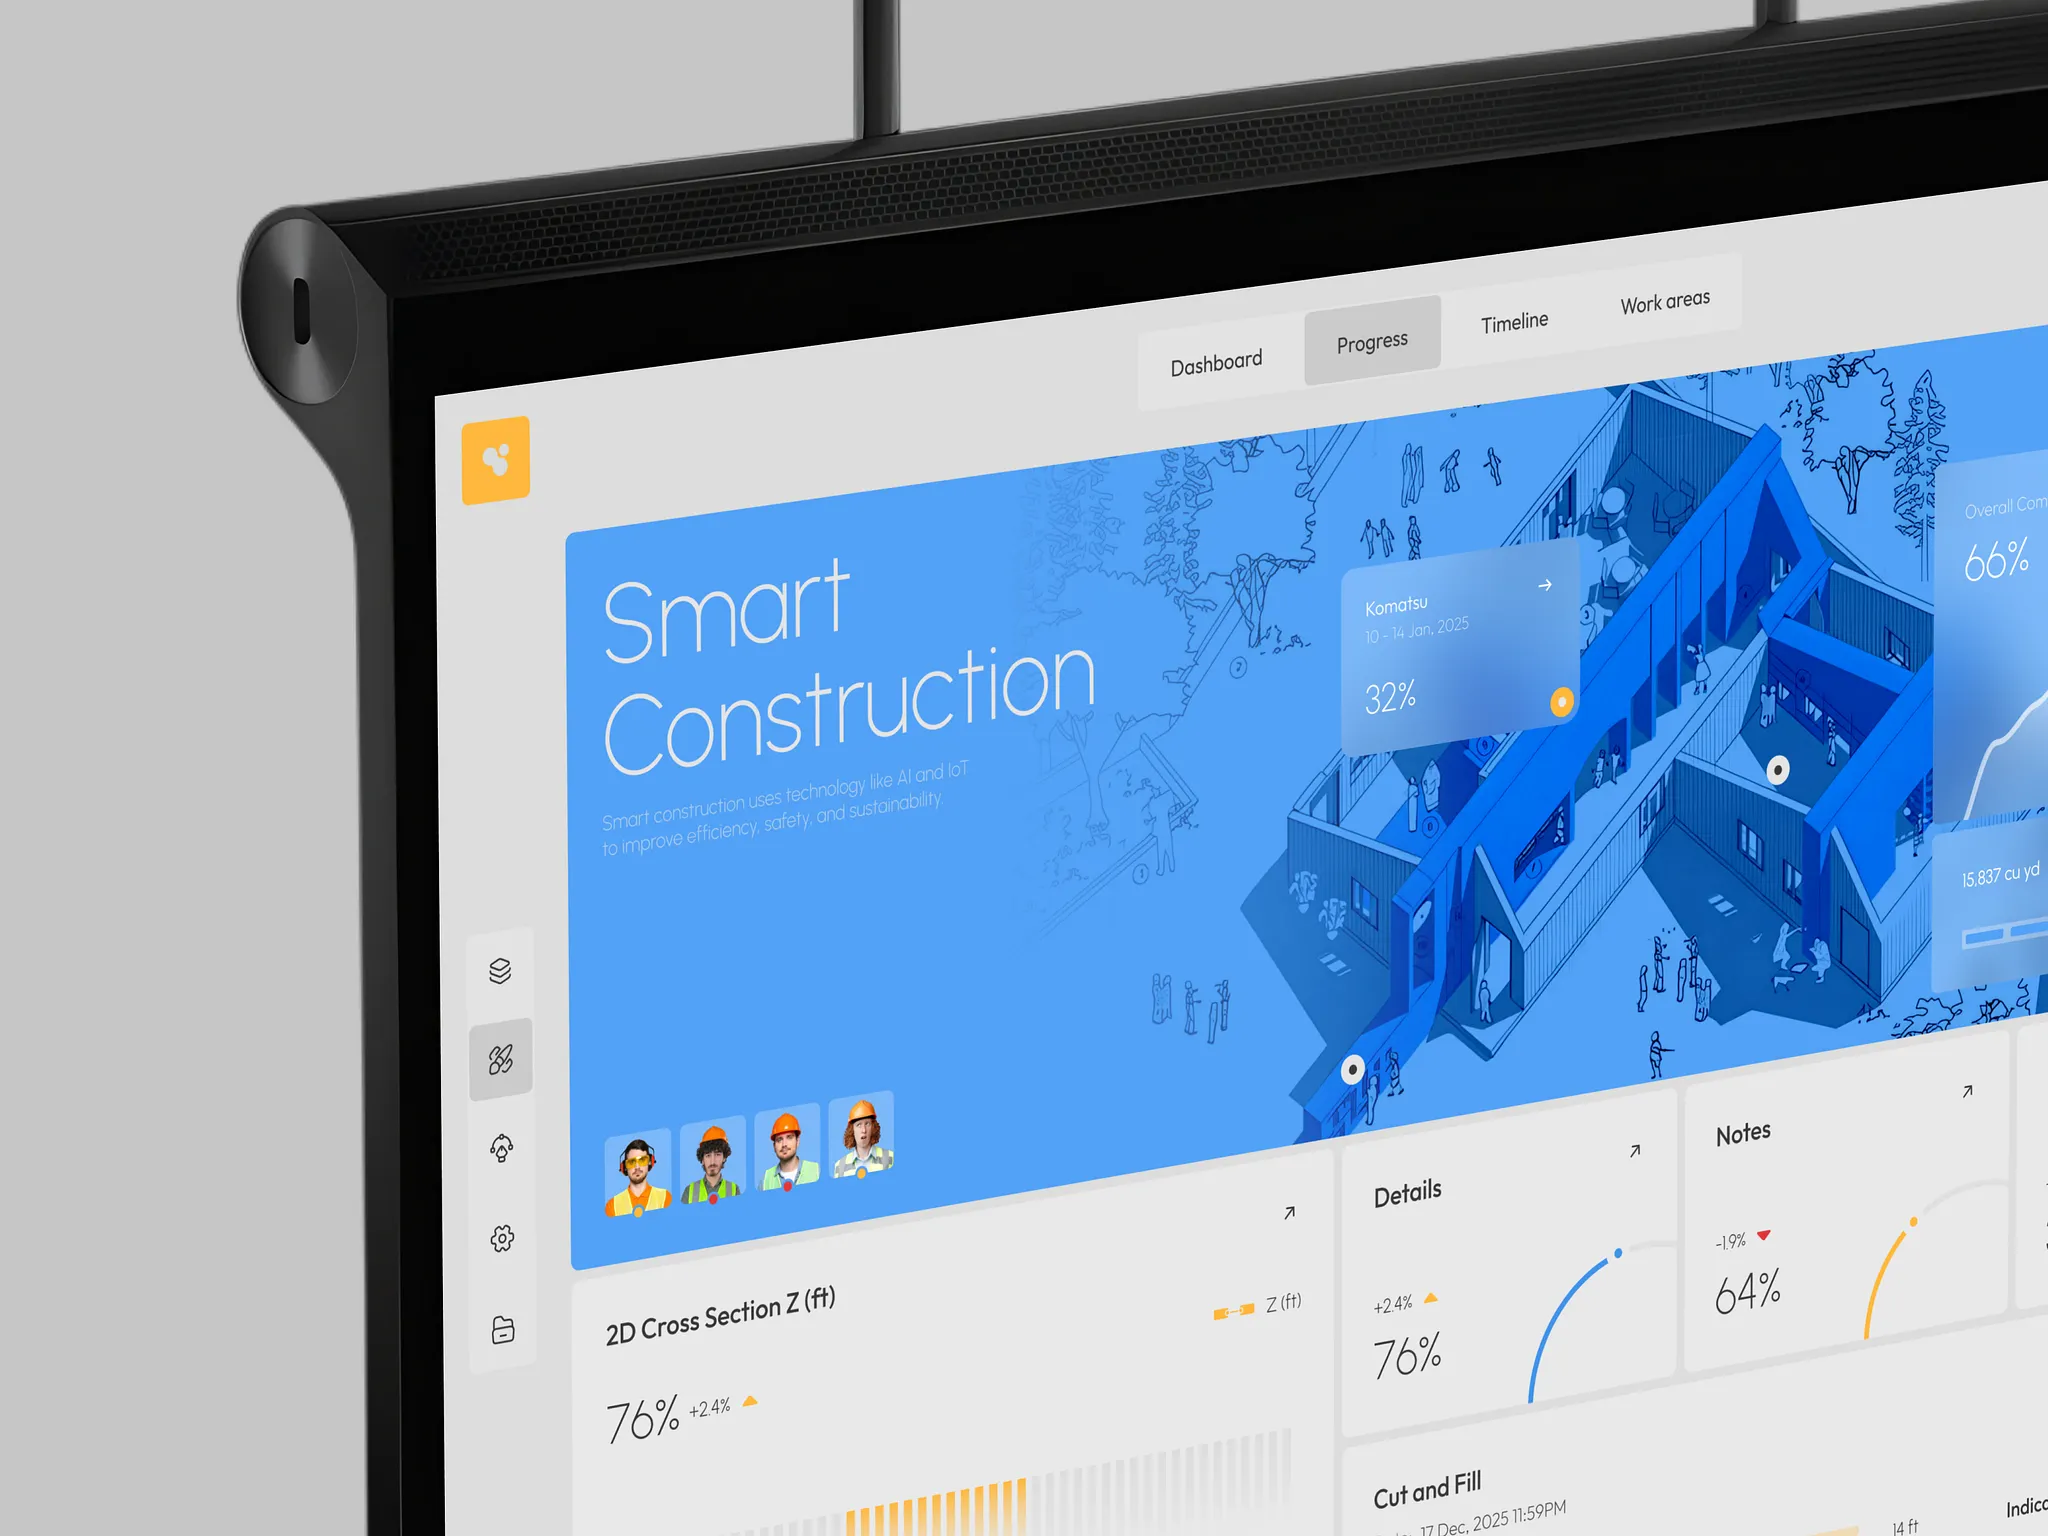
I’m a Headline
I’m a Sub Headline
Lorem ipsum dolor sit amet, consectetur adipiscing elit. Quisque condimentum consectetur arcu, tristique sollicitudin tortor facilisis in.
This is regular link

Button 1
Button 2
Button 3
Roboto Thin
Roboto Light
Roboto Regular
Roboto Medium
Roboto Bold
Roboto Black
Blues, Grays, & Yellow for highlights.
Design Principles:
Clean, modern, professional
Rounded corners, soft shadows, and high contrast for readability
A blue background promises a tranquil environment – while promoting a sense of trust which is an essential emotion to be kept in mind while designing for healthcare sector.
Primary Colors
Secondary Colors
Primary 1
#0073AE
Primary 2
#00A4E4
Primary 3
#CAE3E9
Secondary 01
#01395A
Secondary 02
#4D4D4D
Secondary 03
#808284
Secondary 04
#D8D8D8
Secondary 05
#F2F2F2
RATIO OF USAGE- 5:3:2:1
Design system
Branding Guidelines with Color Pallet, Typography etc.
Logo


Risk Assessment

Cybersecurity


Secondary 1
#01395A
Primary 1
#0273AE
Neutral 4
#5C1B86
Font
ZCOOL XiaoWei
Regular
Logo Brief:
This logo brief outlines how Cybersecurity Risk Assessment AI is an advanced platform designed to evaluate and mitigate security risks using artificial intelligence. It focuses on three key principles: Protection, Intelligence, and Trust. These principles encompass a range of capabilities and features aimed at delivering proactive risk analysis, smart threat detection, and reliable security insights for organizations operating in a connected digital ecosystem. The logo serves as the visual representation of this mission, symbolizing innovation and precision in cybersecurity powered by AI.
Cybersecurity


Cybersecurity

Cybersecurity

Layout Grid
1440 Desktop Side Menu Collapse
1440 Desktop Side Menu Expand
1440 Login Screen
744 iPad
393 iPhone
Color


Risk Assessment

Color
Primary Colors
Secondary Colors
Primary 1
#0073AE
Primary 2
#00A4E4
Primary 3
#CAE3E9
Secondary 01
#01395A
Secondary 02
#4D4D4D
Secondary 03
#808284
Secondary 04
#D8D8D8
Secondary 05
#F2F2F2
Neutral Colors
Neutral 1
#000000
Neutral 2
#FFFFFF
Neutral 3
#7D8EDF
Neutral 4
#418DED
Neutral 5
#0299A3
Neutral 6
#E85763
Neutral 7
#790857
Neutral 8
#002B75
Status Colors
Error
#FF5252
Success
#4CAF50
Warning
#FFC107
Info
#2196F3
Link
Link
#0050FF
Typography


Risk Assessment

Typography
Typescale used 1.125 - Major second,
Base font size 14 pts
Aa
Roboto
Bold
Aa
Roboto
Semibold
Aa
Roboto
Regular
Titles
T1
Title 1
Regular

Line height: 125%
Kerning: -0.6px
The quick brown fox jumps over the lazy dog
T2
Title 2
Regular
Line height: 125%
Kerning: -0.6px
The quick brown fox jumps over the lazy dog
T3
Title 3
Regular
Line height: 125%
Kerning: -0.6px
The quick brown fox jumps over the lazy dog
Semibold
Line height: 125%
Kerning: -0.6px
The quick brown fox jumps over the lazy dog
Semibold
Line height: 125%
Kerning: -0.6px
The quick brown fox jumps over the lazy dog
Semibold
Line height: 125%
Kerning: -0.6px
The quick brown fox jumps over the lazy dog
Headings
H1
Heading 1
Regular
Line height: 150%
Kerning: 0px
The quick brown fox jumps over the lazy dog
H2
Heading 2
Regular
Line height: 150%
Kerning: 0px
The quick brown fox jumps over the lazy dog
H3
Heading 3
Regular
Line height: 150%
Kerning: 0px
The quick brown fox jumps over the lazy dog
H4
Heading 4
Regular
Line height: 150%
Kerning: 0px
The quick brown fox jumps over the lazy dog
H5
Heading 5
Regular
Line height: 150%
Kerning: 0px
The quick brown fox jumps over the lazy dog
H6
Heading 6
Regular
Line height: 150%
Kerning: 0px
The quick brown fox jumps over the lazy dog
Medium
Line height: 150%
Kerning: 0px
The quick brown fox jumps over the lazy dog
Medium
Line height: 150%
Kerning: 0px
The quick brown fox jumps over the lazy dog
Medium
Line height: 150%
Kerning: 0px
The quick brown fox jumps over the lazy dog
Medium
Line height: 150%
Kerning: 0px
The quick brown fox jumps over the lazy dog
Medium
Line height: 150%
Kerning: 0px
The quick brown fox jumps over the lazy dog
Medium
Line height: 150%
Kerning: 0px
The quick brown fox jumps over the lazy dog
Semibold
Line height: 150%
Kerning: 0px
The quick brown fox jumps over the lazy dog
Semibold
Line height: 150%
Kerning: 0px
The quick brown fox jumps over the lazy dog
Semibold
Line height: 150%
Kerning: 0px
The quick brown fox jumps over the lazy dog
Semibold
Line height: 150%
Kerning: 0px
The quick brown fox jumps over the lazy dog
Semibold
Line height: 150%
Kerning: 0px
The quick brown fox jumps over the lazy dog
Semibold
Line height: 150%
Kerning: 0px
The quick brown fox jumps over the lazy dog
Paragraphs
P3
Paragraph 3
Regular
Line height: 150%
Kerning: 0.2px
An organization’s most valuable asset is its people, so we designed our three-pillar People Success Model to bridge the gap between people and strategy. Align your people’s performance to strategic execution to achieve organizational objectives.
Medium
Line height: 150%
Kerning: 0.2px
An organization’s most valuable asset is its people, so we designed our three-pillar People Success Model to bridge the gap between people and strategy. Align your people’s performance to strategic execution to achieve organizational objectives.
Semibold
Line height: 150%
Kerning: 0.2px
An organization’s most valuable asset is its people, so we designed our three-pillar People Success Model to bridge the gap between people and strategy. Align your people’s performance to strategic execution to achieve organizational objectives.
P4
Paragraph 4
Regular
Line height: 150%
Kerning: 0.2px
An organization’s most valuable asset is its people, so we designed our three-pillar People Success Model to bridge the gap between people and strategy. Align your people’s performance to strategic execution to achieve organizational objectives.
Medium
Line height: 150%
Kerning: 0.2px
An organization’s most valuable asset is its people, so we designed our three-pillar People Success Model to bridge the gap between people and strategy. Align your people’s performance to strategic execution to achieve organizational objectives.
Semibold
Line height: 150%
Kerning: 0.2px
An organization’s most valuable asset is its people, so we designed our three-pillar People Success Model to bridge the gap between people and strategy. Align your people’s performance to strategic execution to achieve organizational objectives.
P5
Paragraph 5
Regular
Line height: 150%
Kerning: 0.2px
An organization’s most valuable asset is its people, so we designed our three-pillar People Success Model to bridge the gap between people and strategy. Align your people’s performance to strategic execution to achieve organizational objectives.
Medium
Line height: 150%
Kerning: 0.2px
An organization’s most valuable asset is its people, so we designed our three-pillar People Success Model to bridge the gap between people and strategy. Align your people’s performance to strategic execution to achieve organizational objectives.
Semibold
Line height: 150%
Kerning: 0.2px
An organization’s most valuable asset is its people, so we designed our three-pillar People Success Model to bridge the gap between people and strategy. Align your people’s performance to strategic execution to achieve organizational objectives.
P6
Paragraph 6
Regular
Line height: 150%
Kerning: 0.2px
An organization’s most valuable asset is its people, so we designed our three-pillar People Success Model to bridge the gap between people and strategy. Align your people’s performance to strategic execution to achieve organizational objectives.
Medium
Line height: 150%
Kerning: 0.2px
An organization’s most valuable asset is its people, so we designed our three-pillar People Success Model to bridge the gap between people and strategy. Align your people’s performance to strategic execution to achieve organizational objectives.
Semibold
Line height: 150%
Kerning: 0.2px
An organization’s most valuable asset is its people, so we designed our three-pillar People Success Model to bridge the gap between people and strategy. Align your people’s performance to strategic execution to achieve organizational objectives.
P7
Paragraph 7
Regular
Line height: 150%
Kerning: 0.2px
An organization’s most valuable asset is its people, so we designed our three-pillar People Success Model to bridge the gap between people and strategy. Align your people’s performance to strategic execution to achieve organizational objectives.
Medium
Line height: 150%
Kerning: 0.2px
An organization’s most valuable asset is its people, so we designed our three-pillar People Success Model to bridge the gap between people and strategy. Align your people’s performance to strategic execution to achieve organizational objectives.
Semibold
Line height: 150%
Kerning: 0.2px
An organization’s most valuable asset is its people, so we designed our three-pillar People Success Model to bridge the gap between people and strategy. Align your people’s performance to strategic execution to achieve organizational objectives.
Others
Caption
Regular
Line height: Auto
Kerning: 0.4px
The quick brown fox jumps over the lazy dog
Button


Risk Assessment

Button
Typescale used 1.125 - Major second,
Base font size 14 pts

Icons with Tooltip


Risk Assessment

Icons with tooltip

Tabs & Navigation Bar


Risk Assessment

Tabs & Navigation Bar


Banner component


Risk Assessment

Banner component








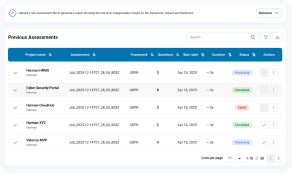









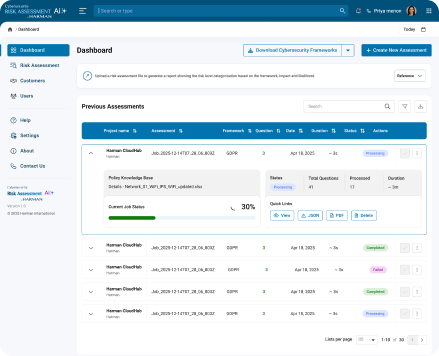

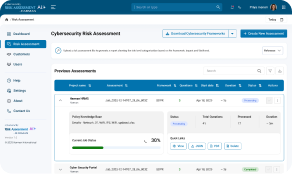










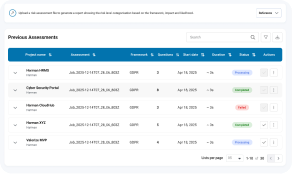




Navigation Bar
Risk Assessment
Navigation Bar
Desktop side bar component
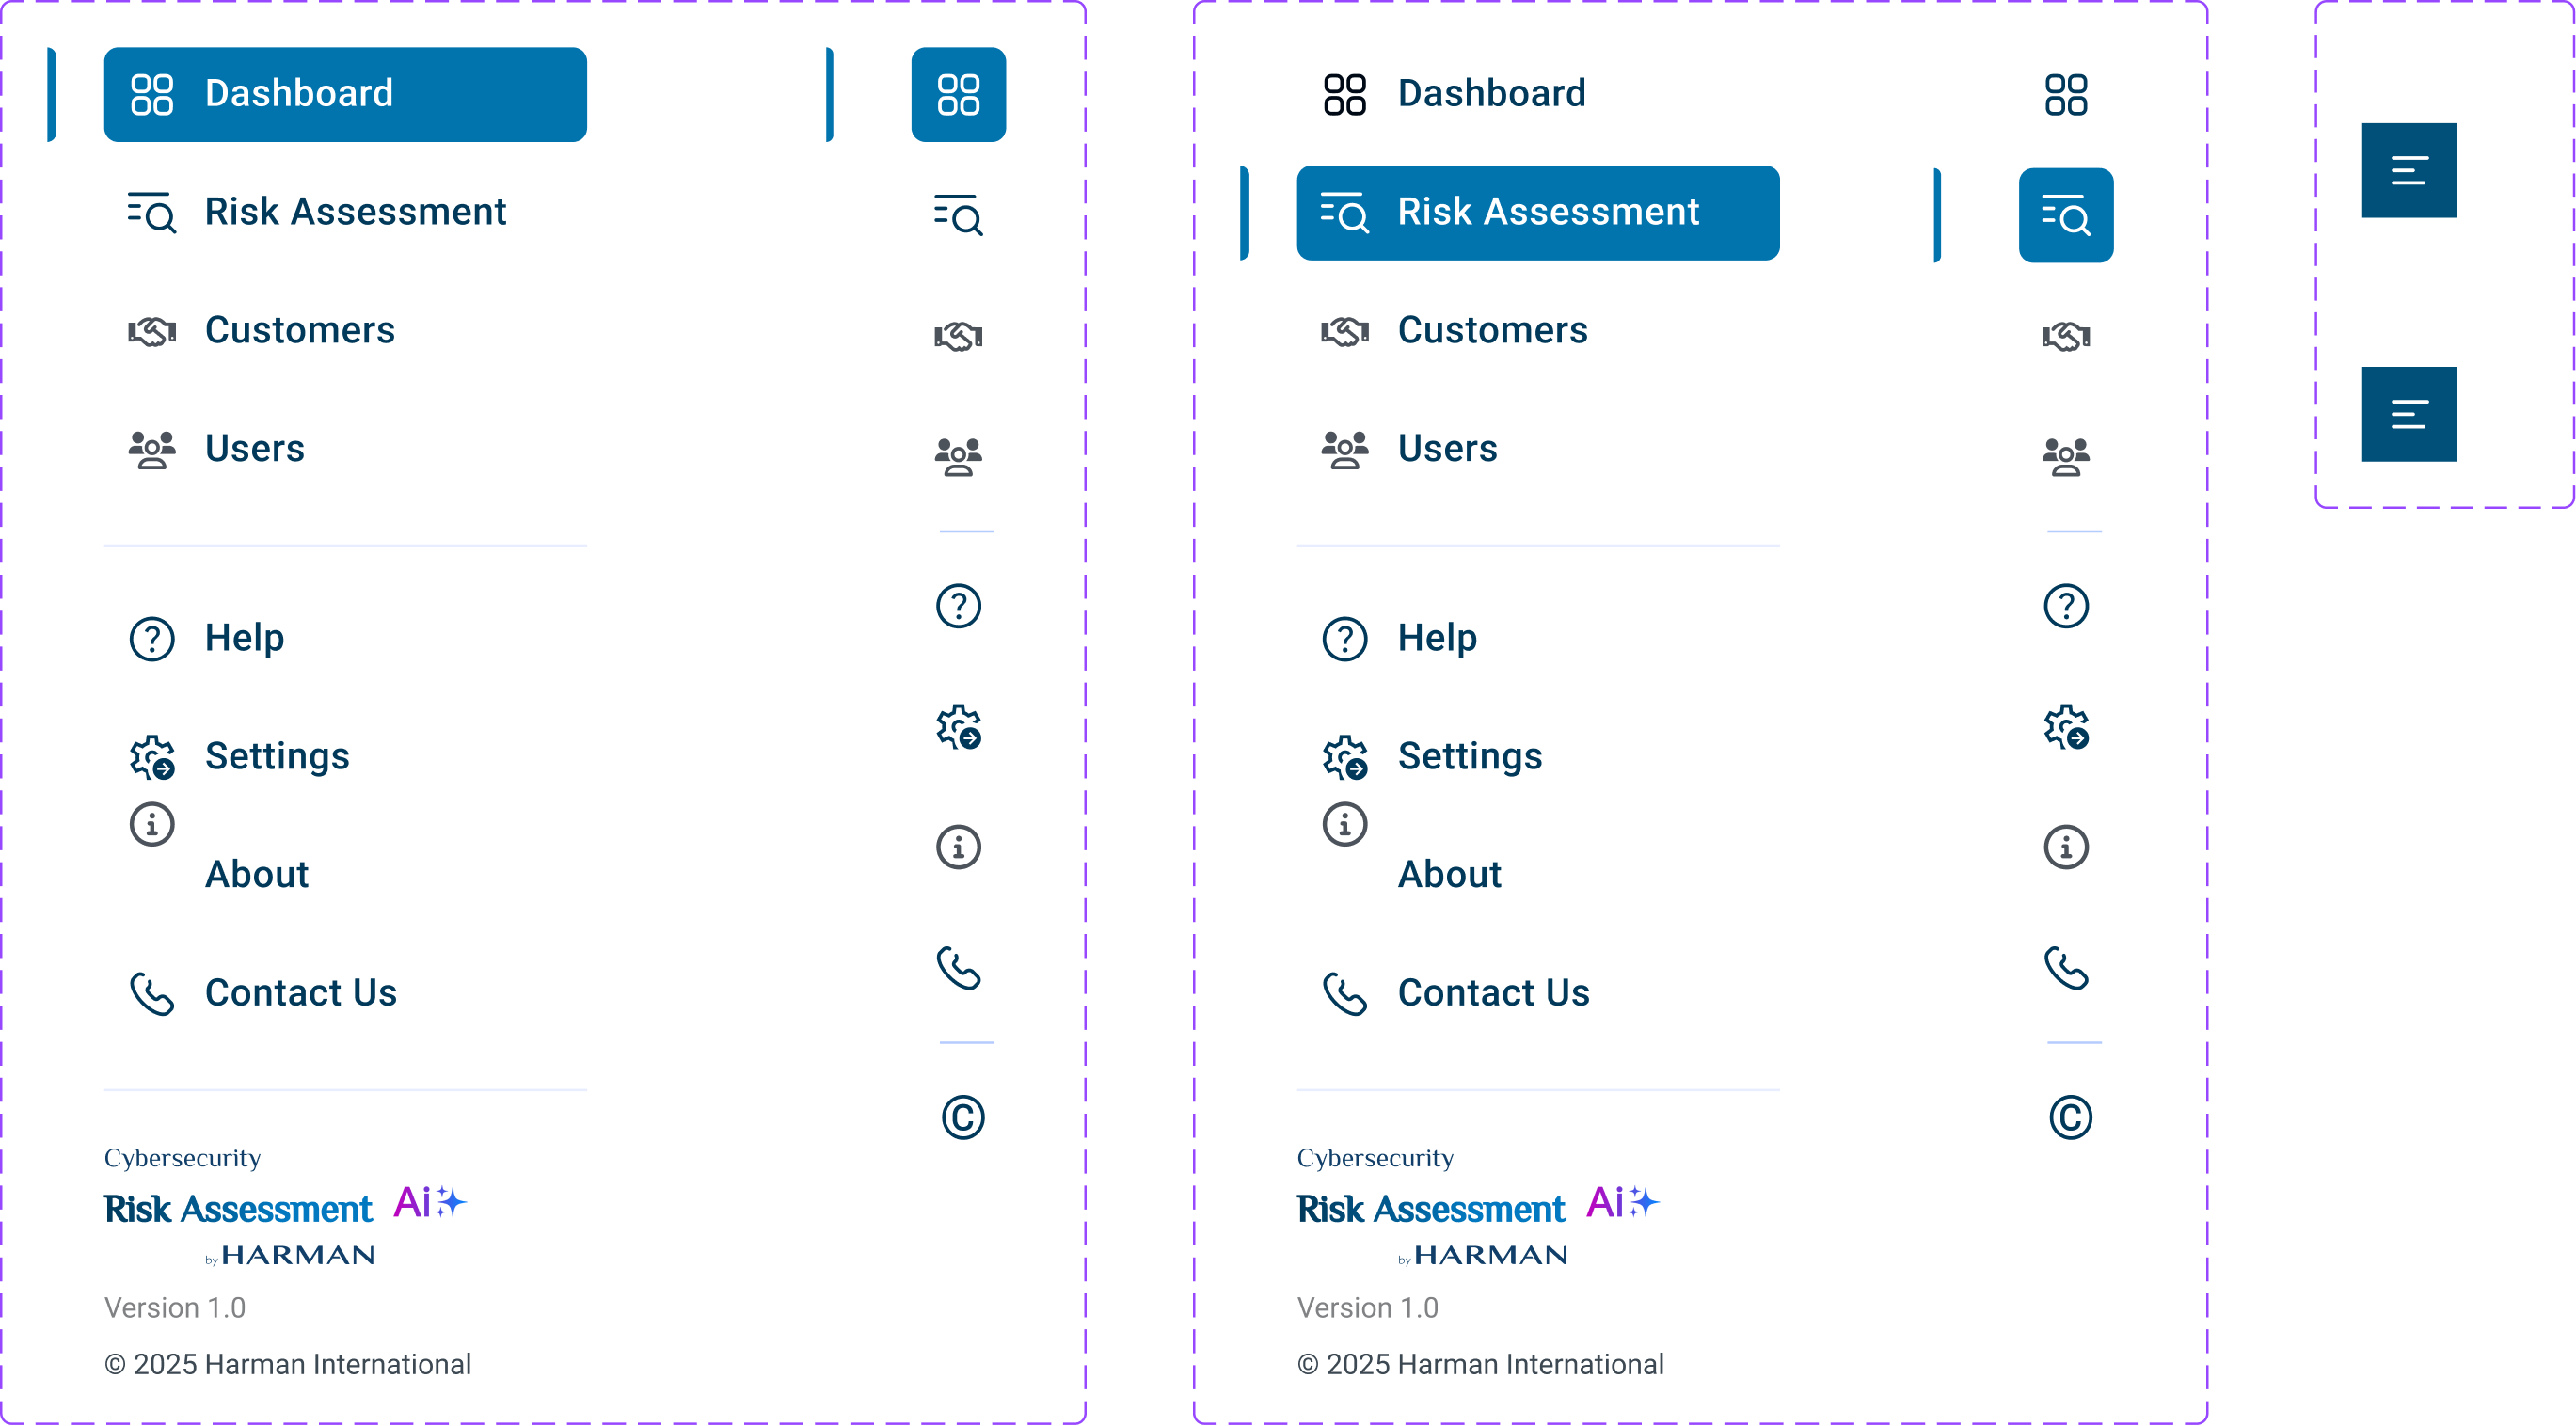
Tabs & Navigation Bar

Desktop Side Bar Component
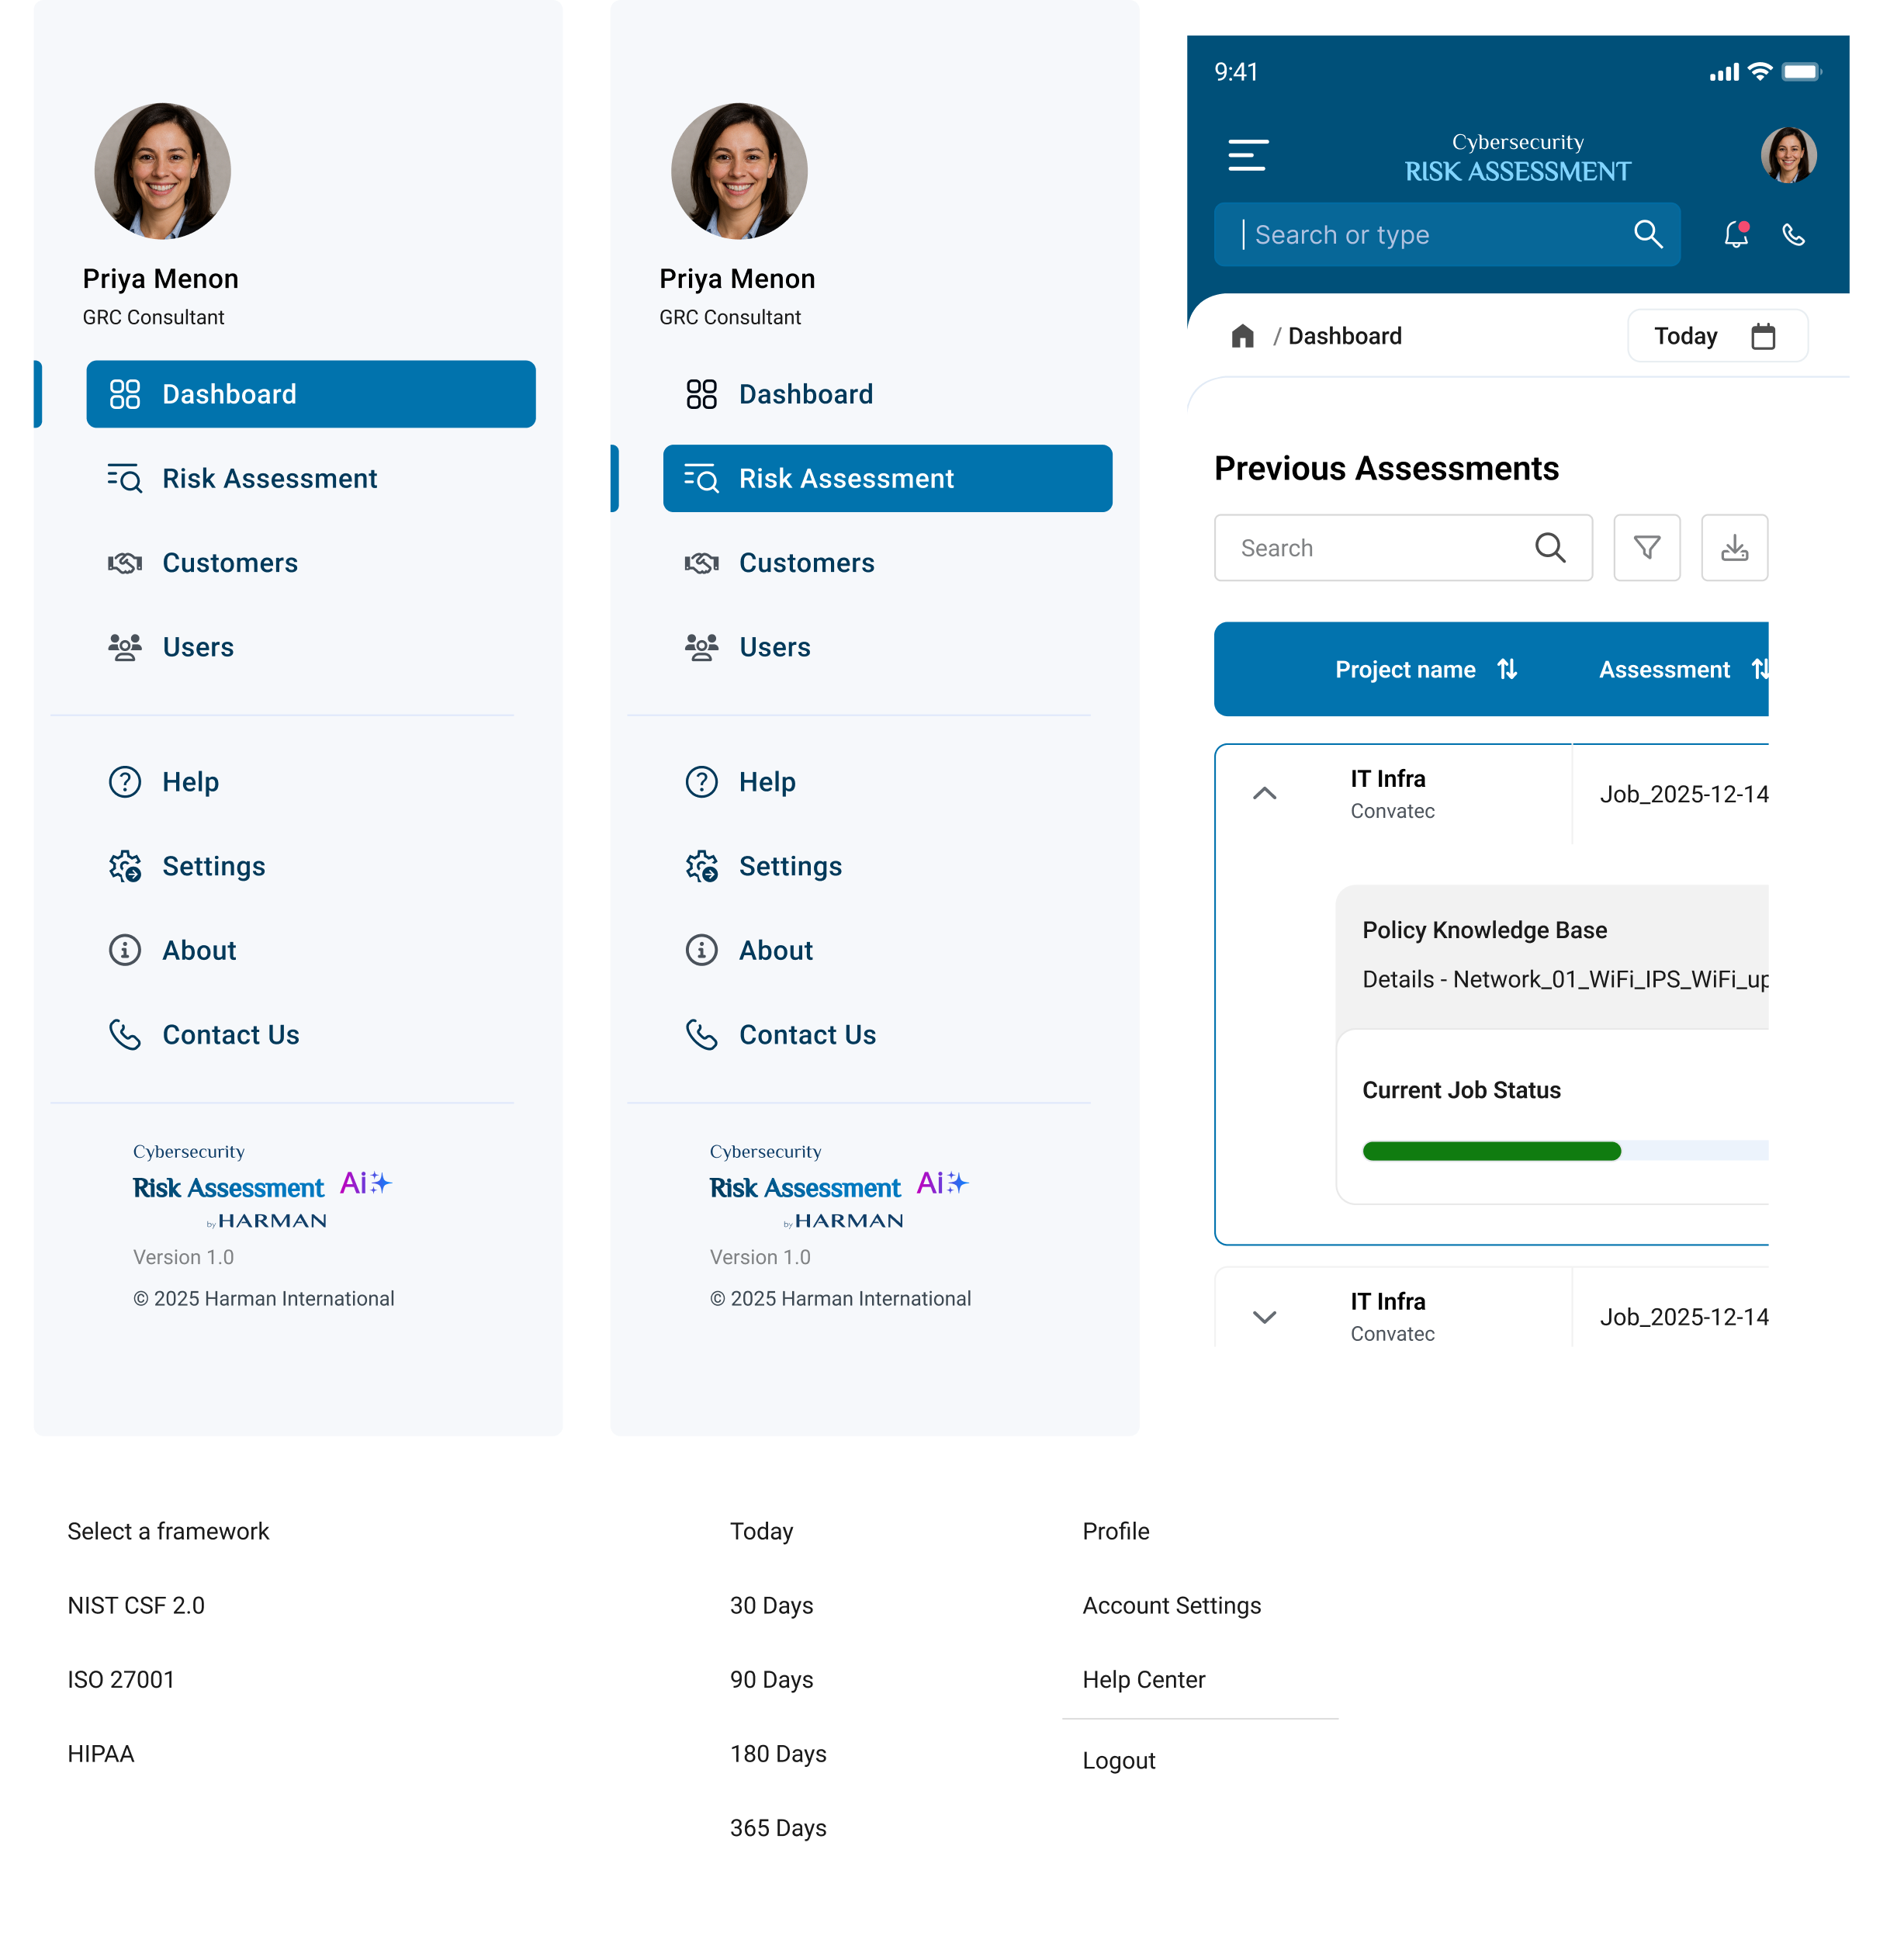
Expand & Collapsible Panel Component

Chips & Badges
Risk Assessment
Chips & Badges
Badges - Style 1
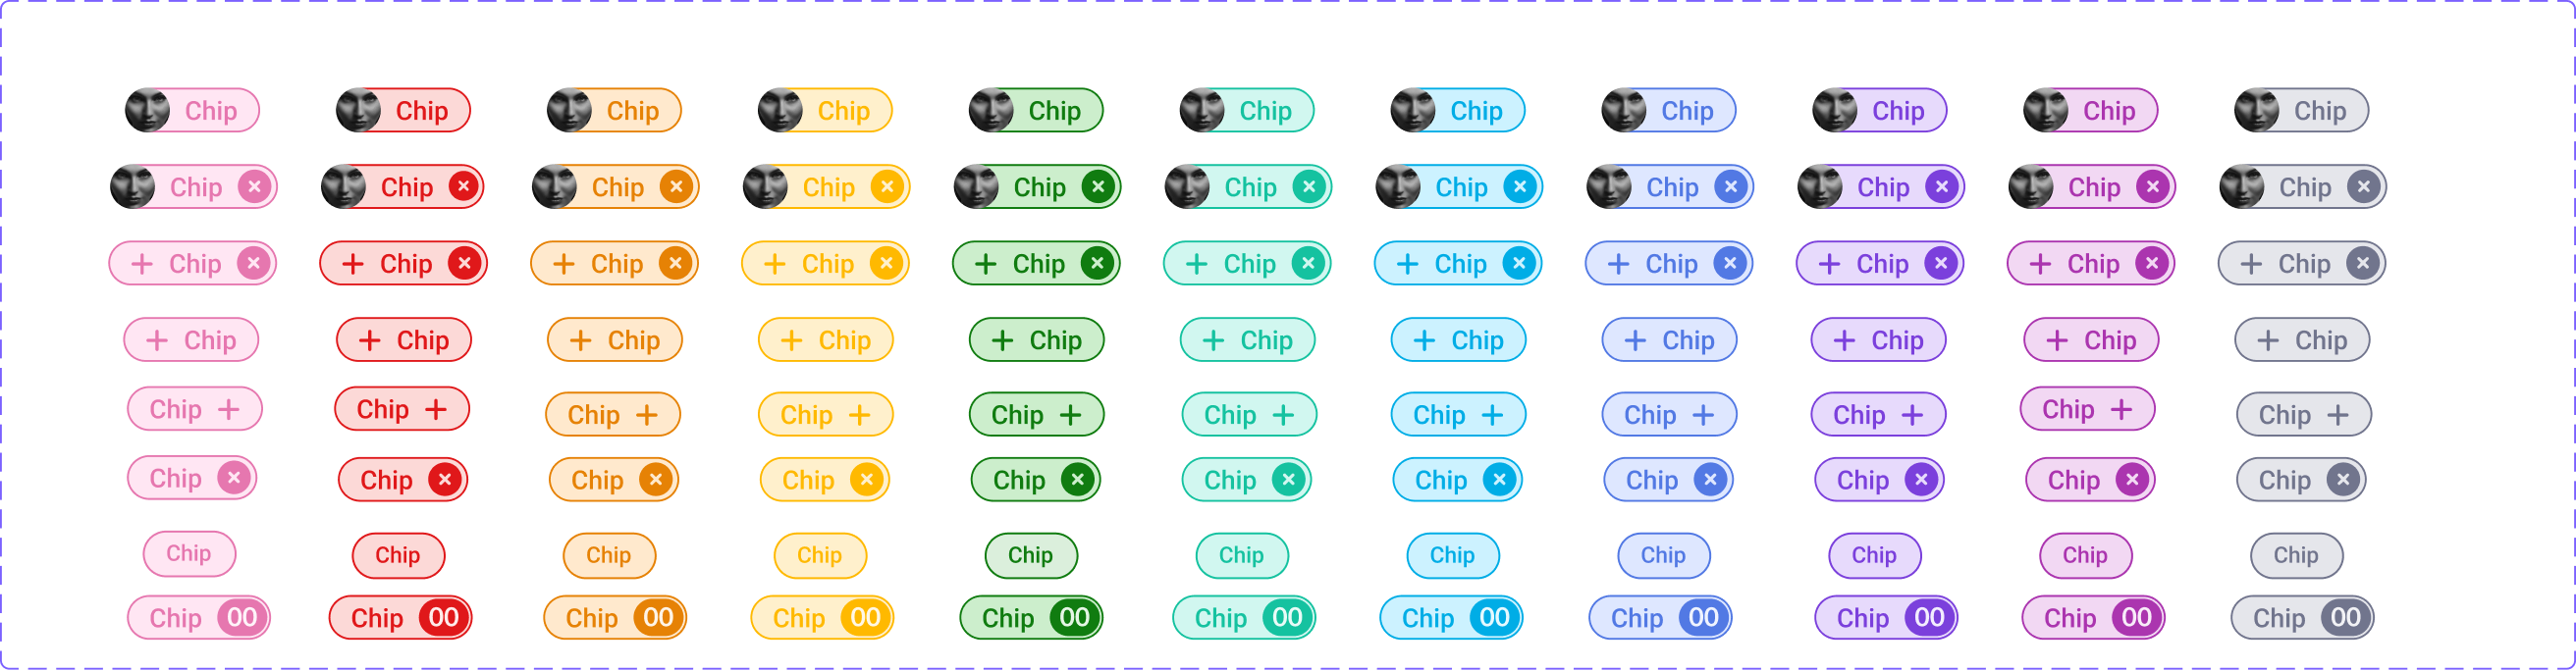
Labels
X Small
Small
Medium
Large
Blue
Orange
Yellow
Red
Green

Labels
X Small
Small
Medium
Large

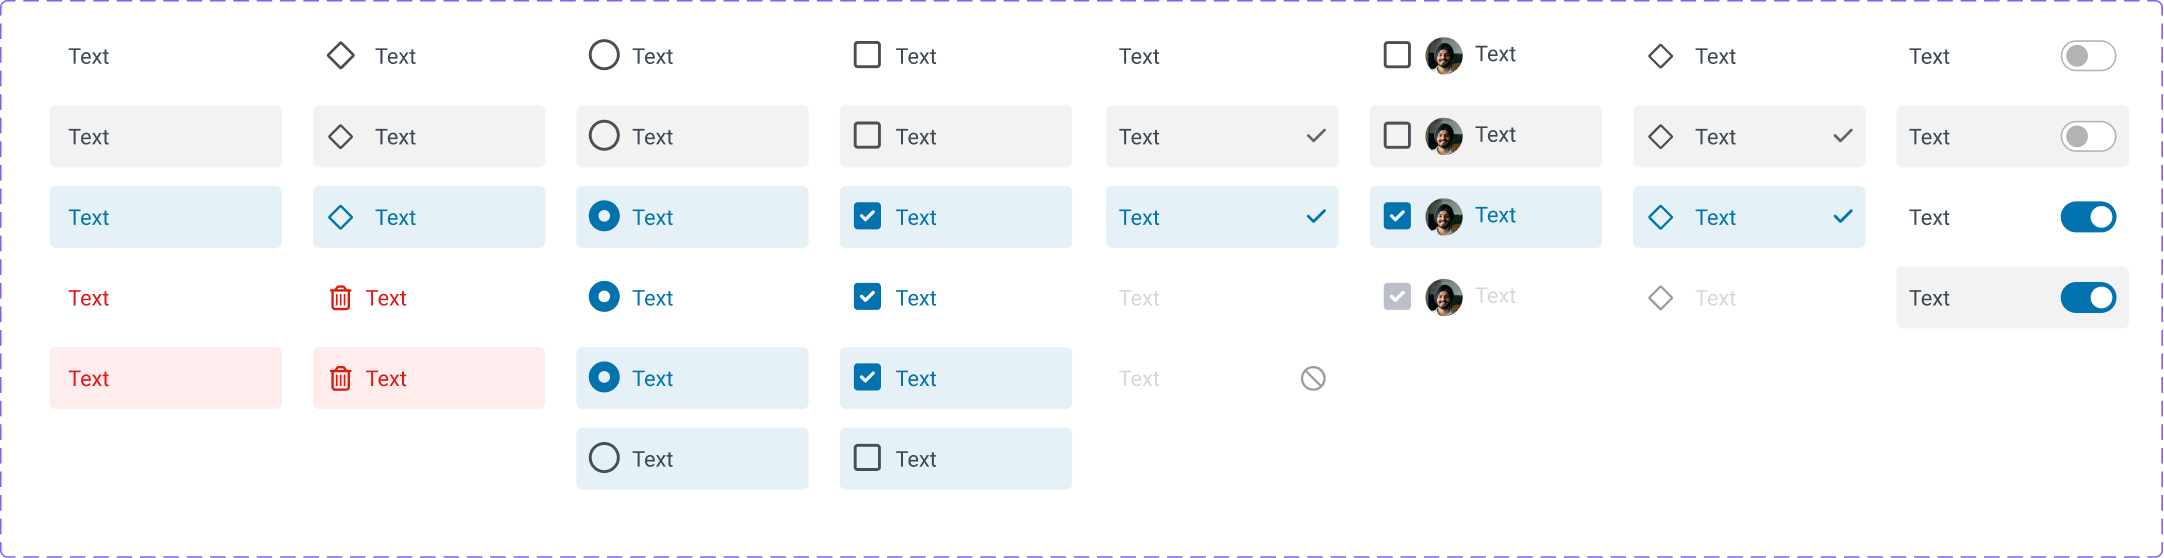
Dropdown
Default
With icon
With radio button
With checkbox
Default
Hover
Select
Default
Hover
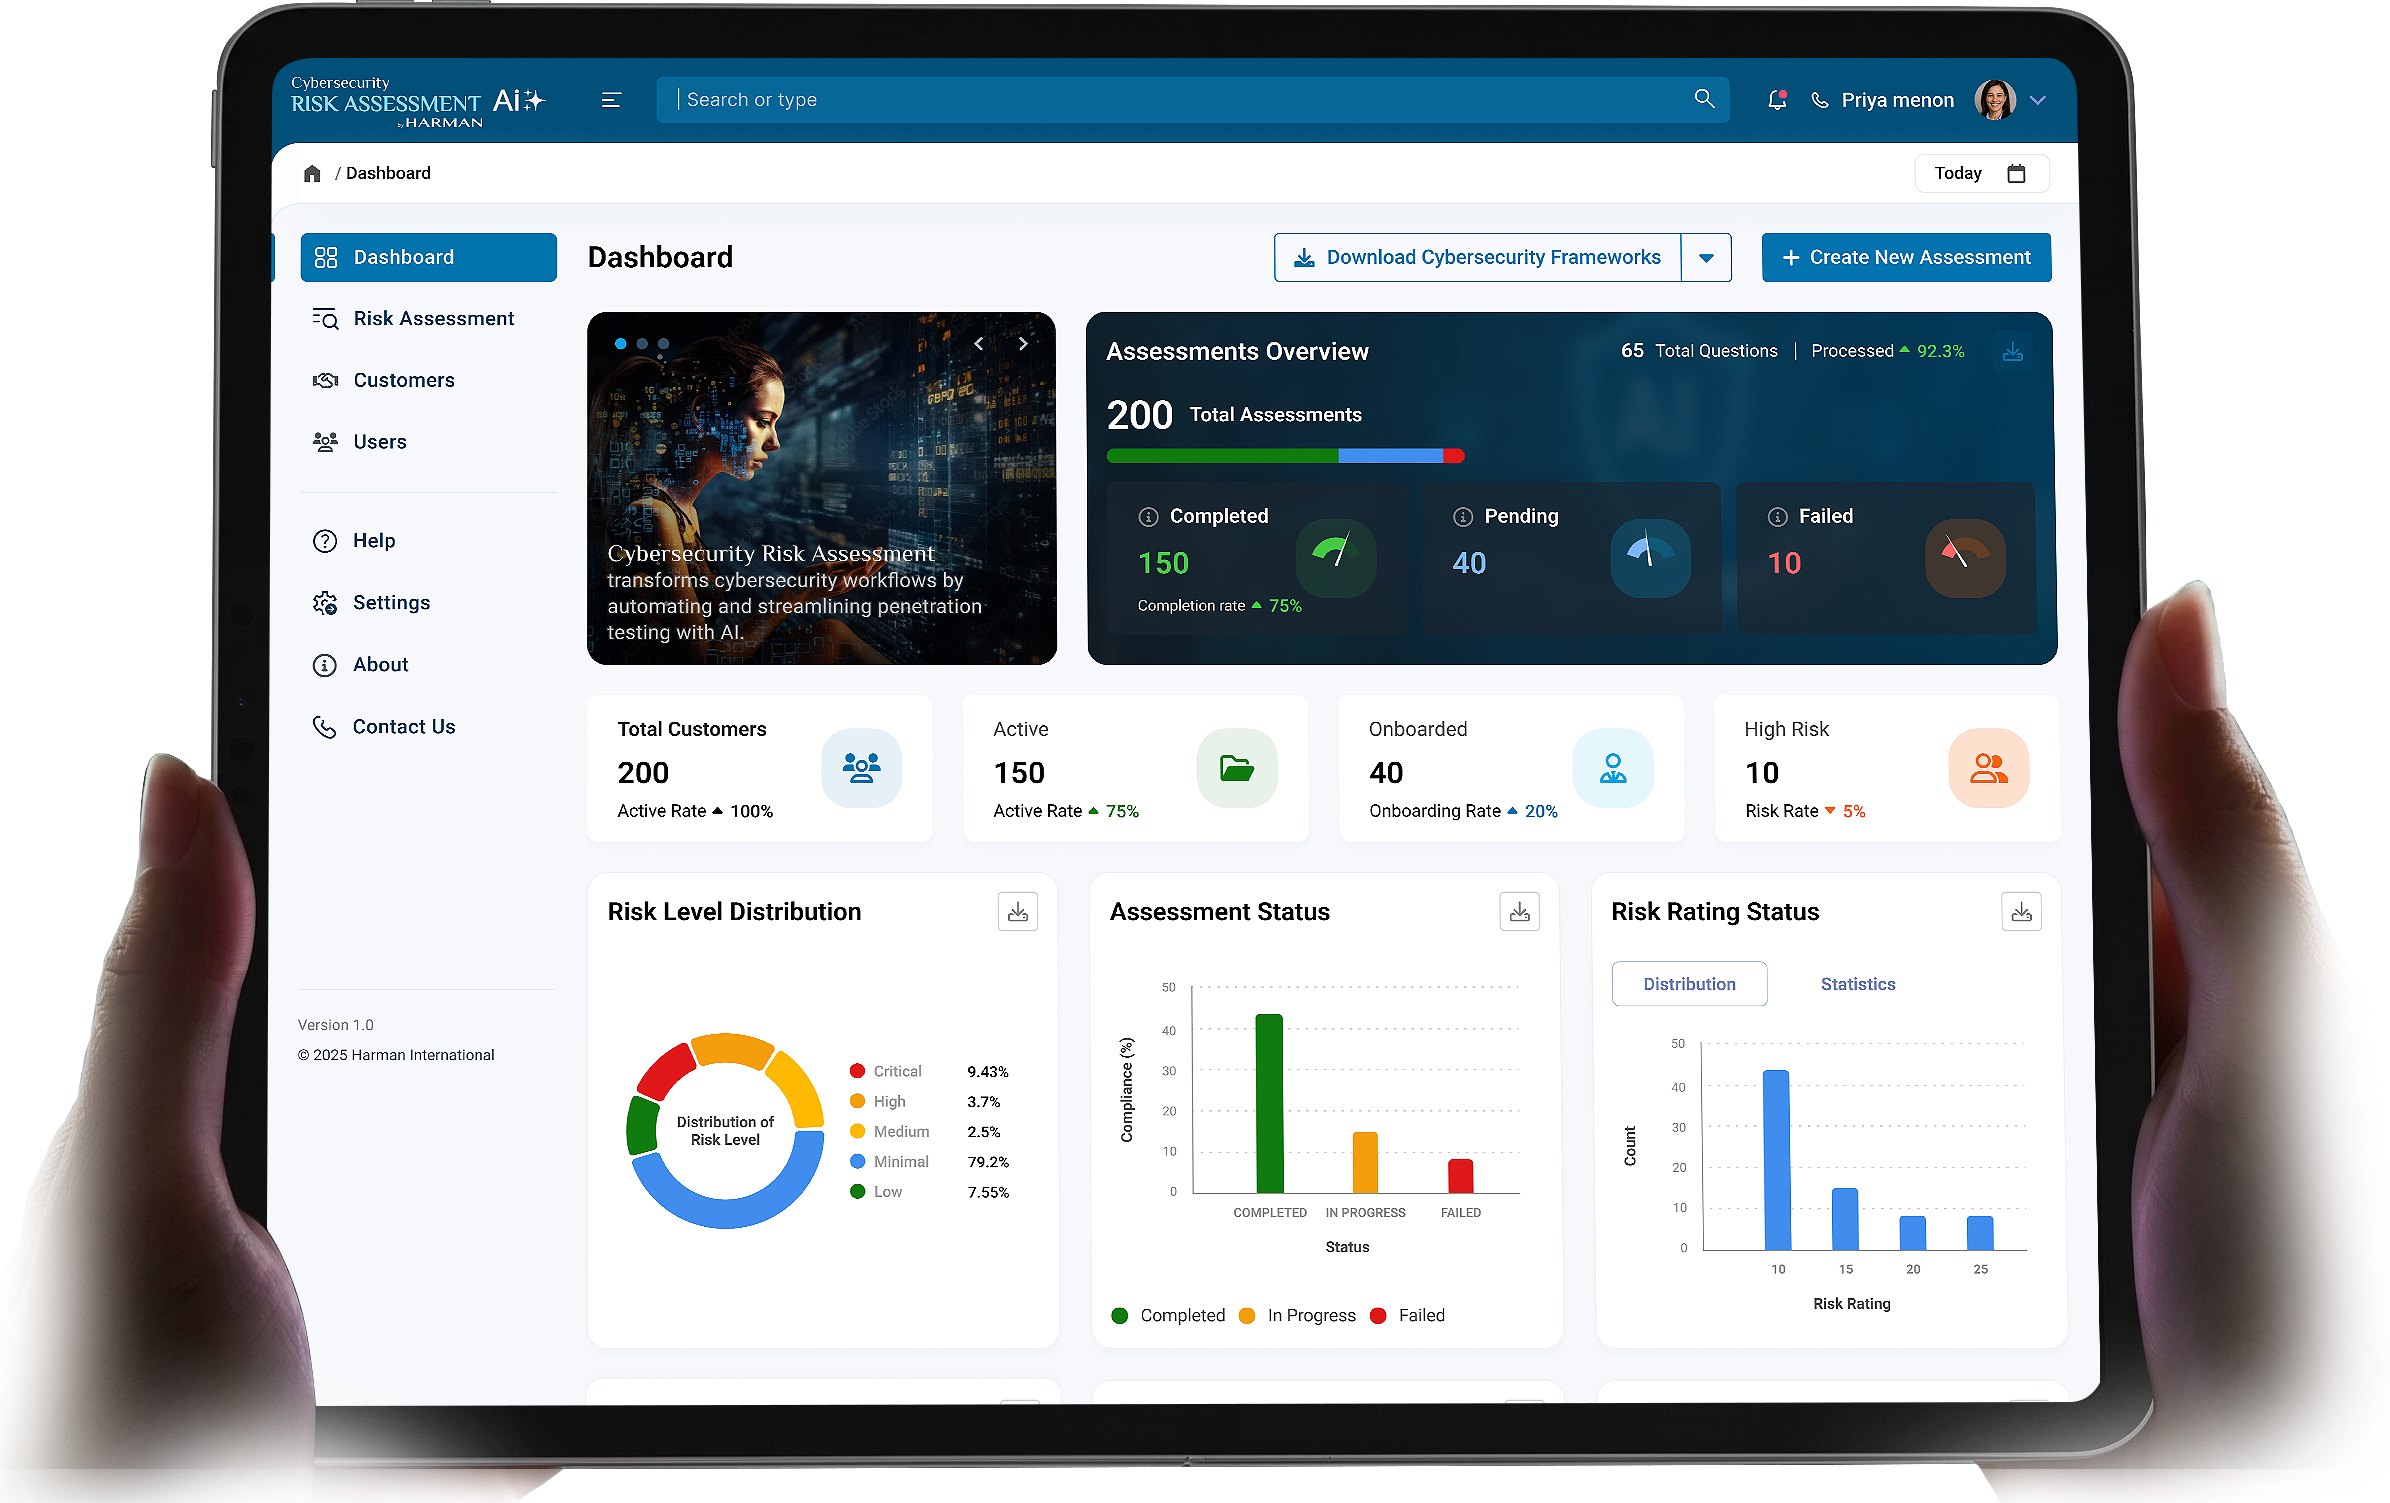
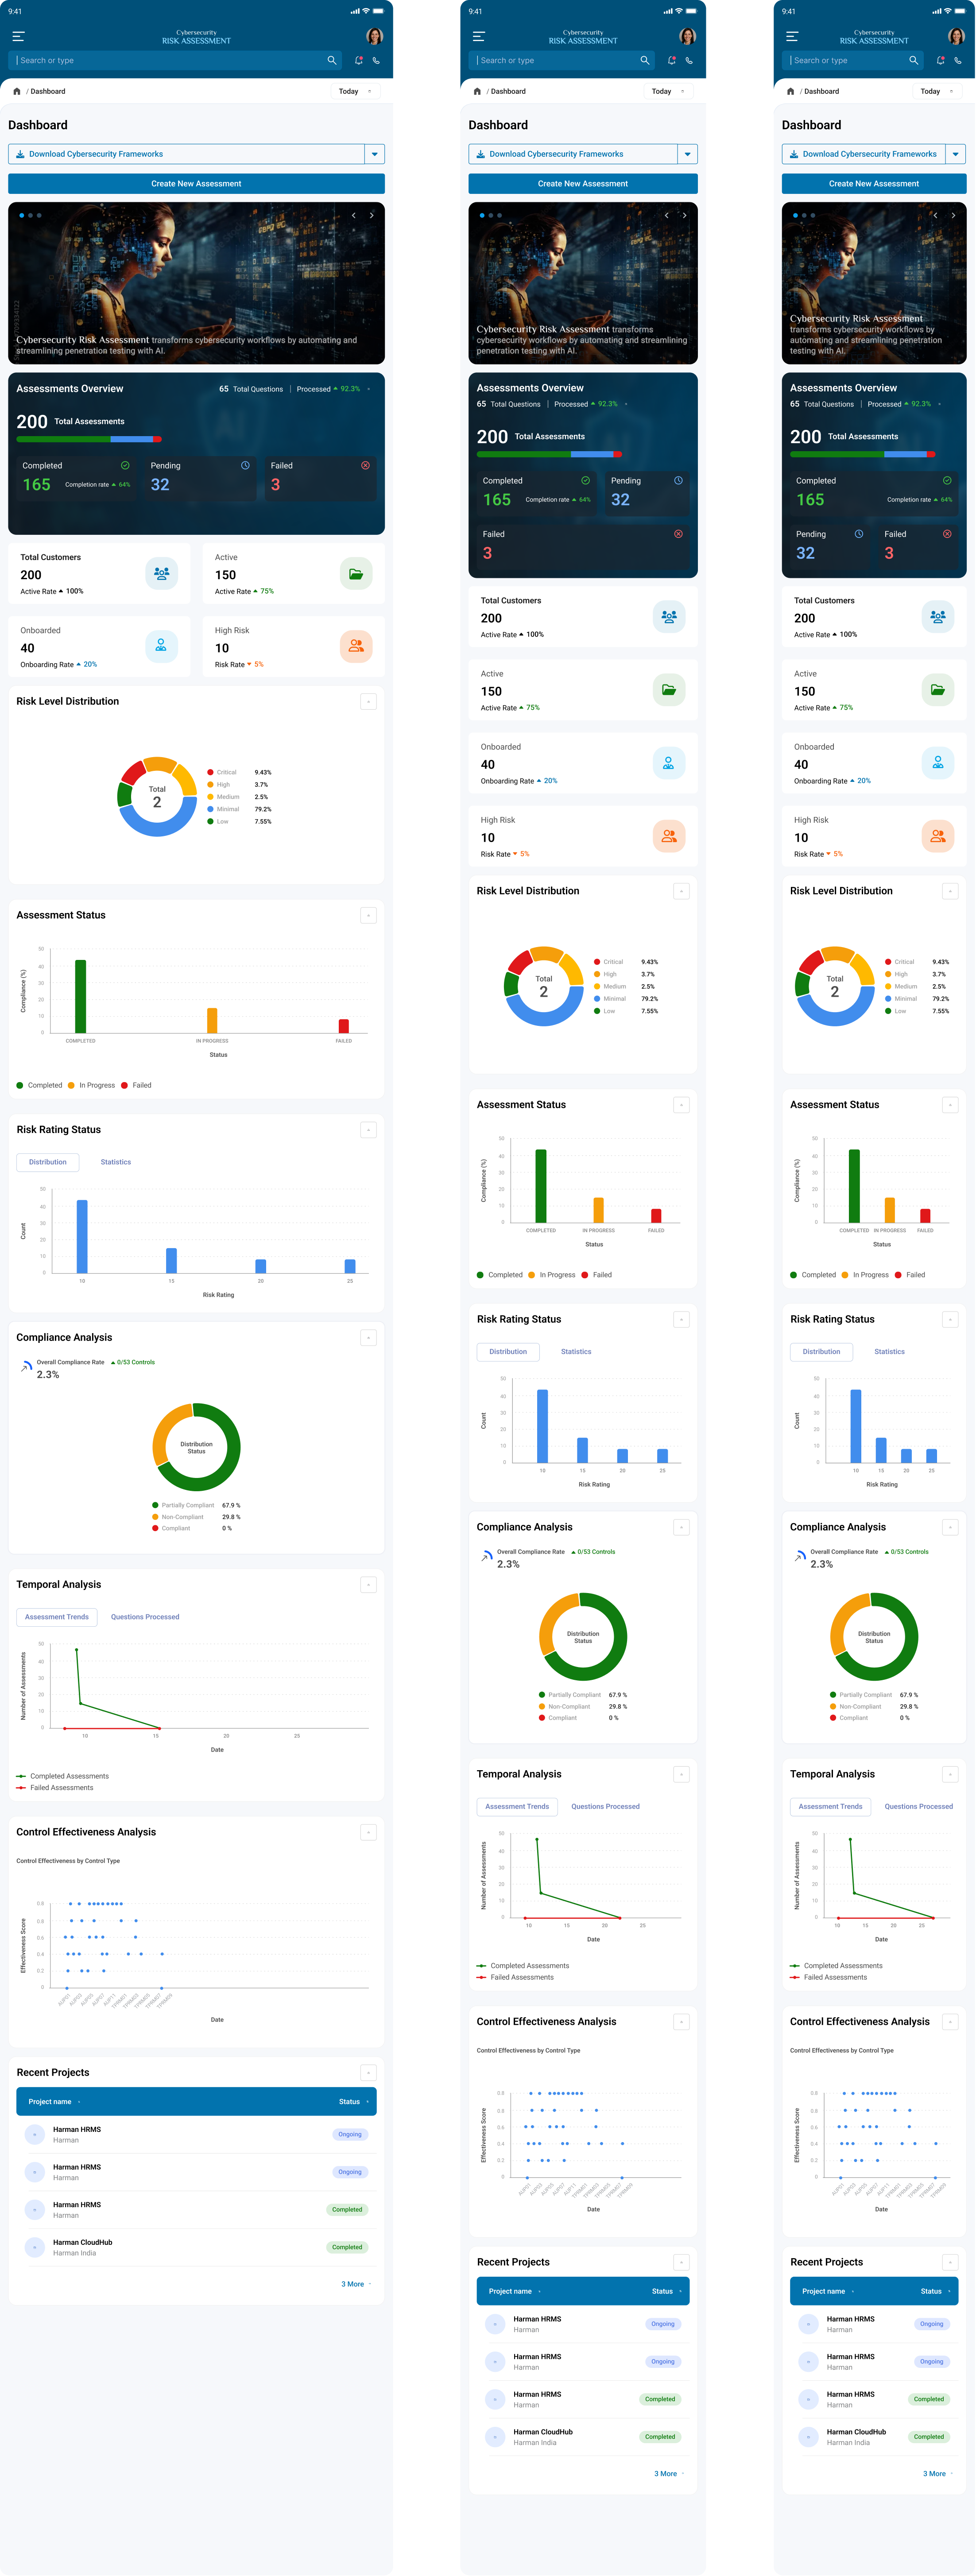
Responsive Visual Design
Responsive visual designs with latest design trends.
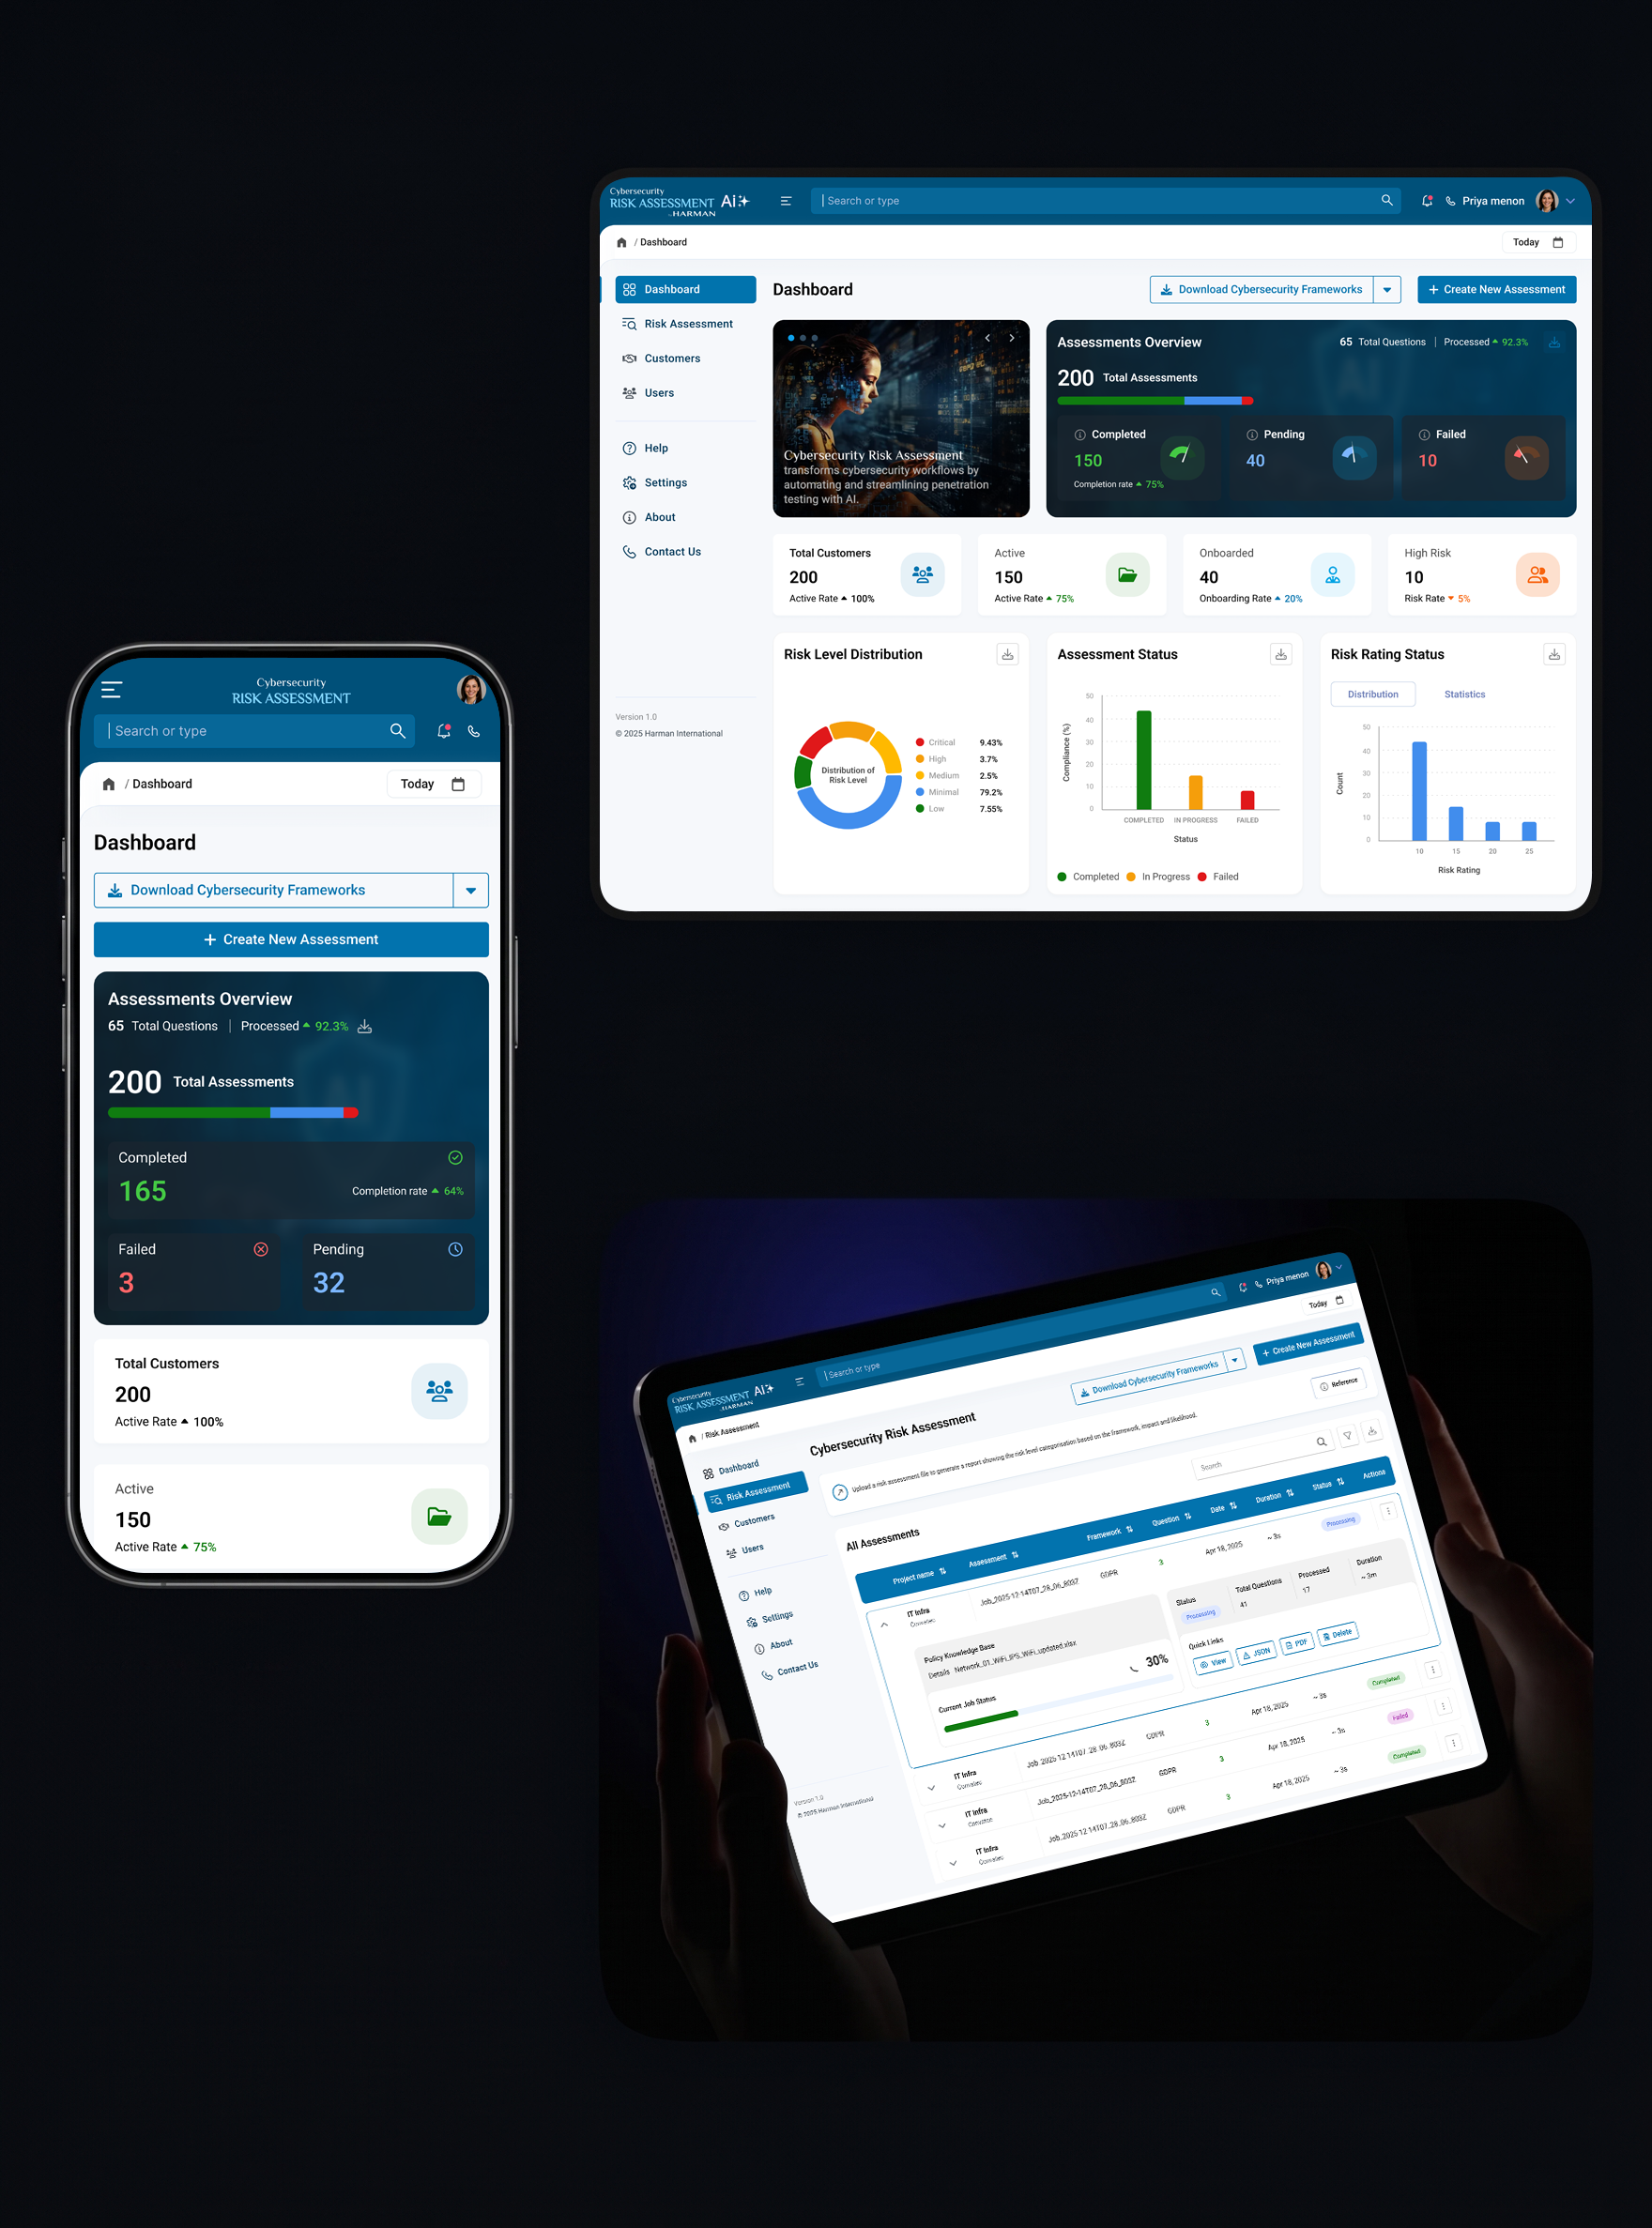
Login

















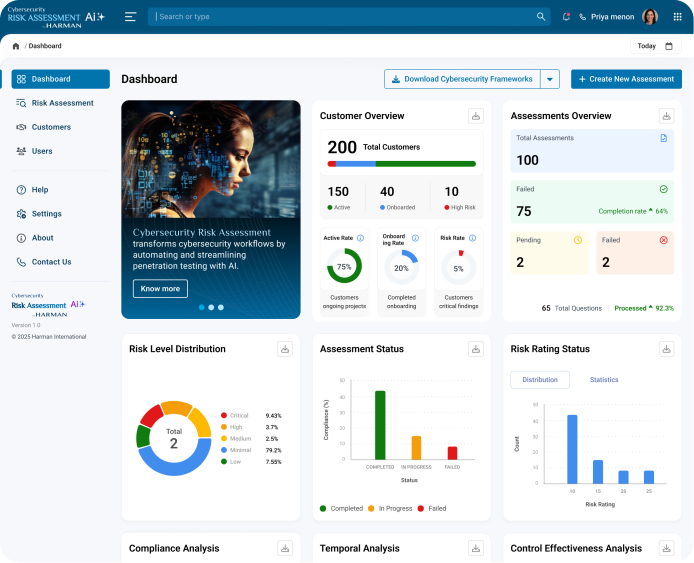

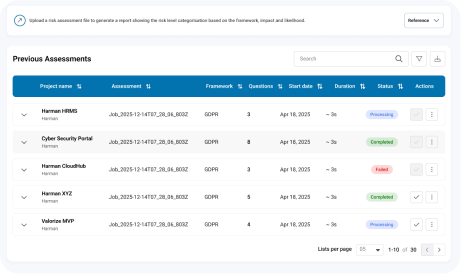



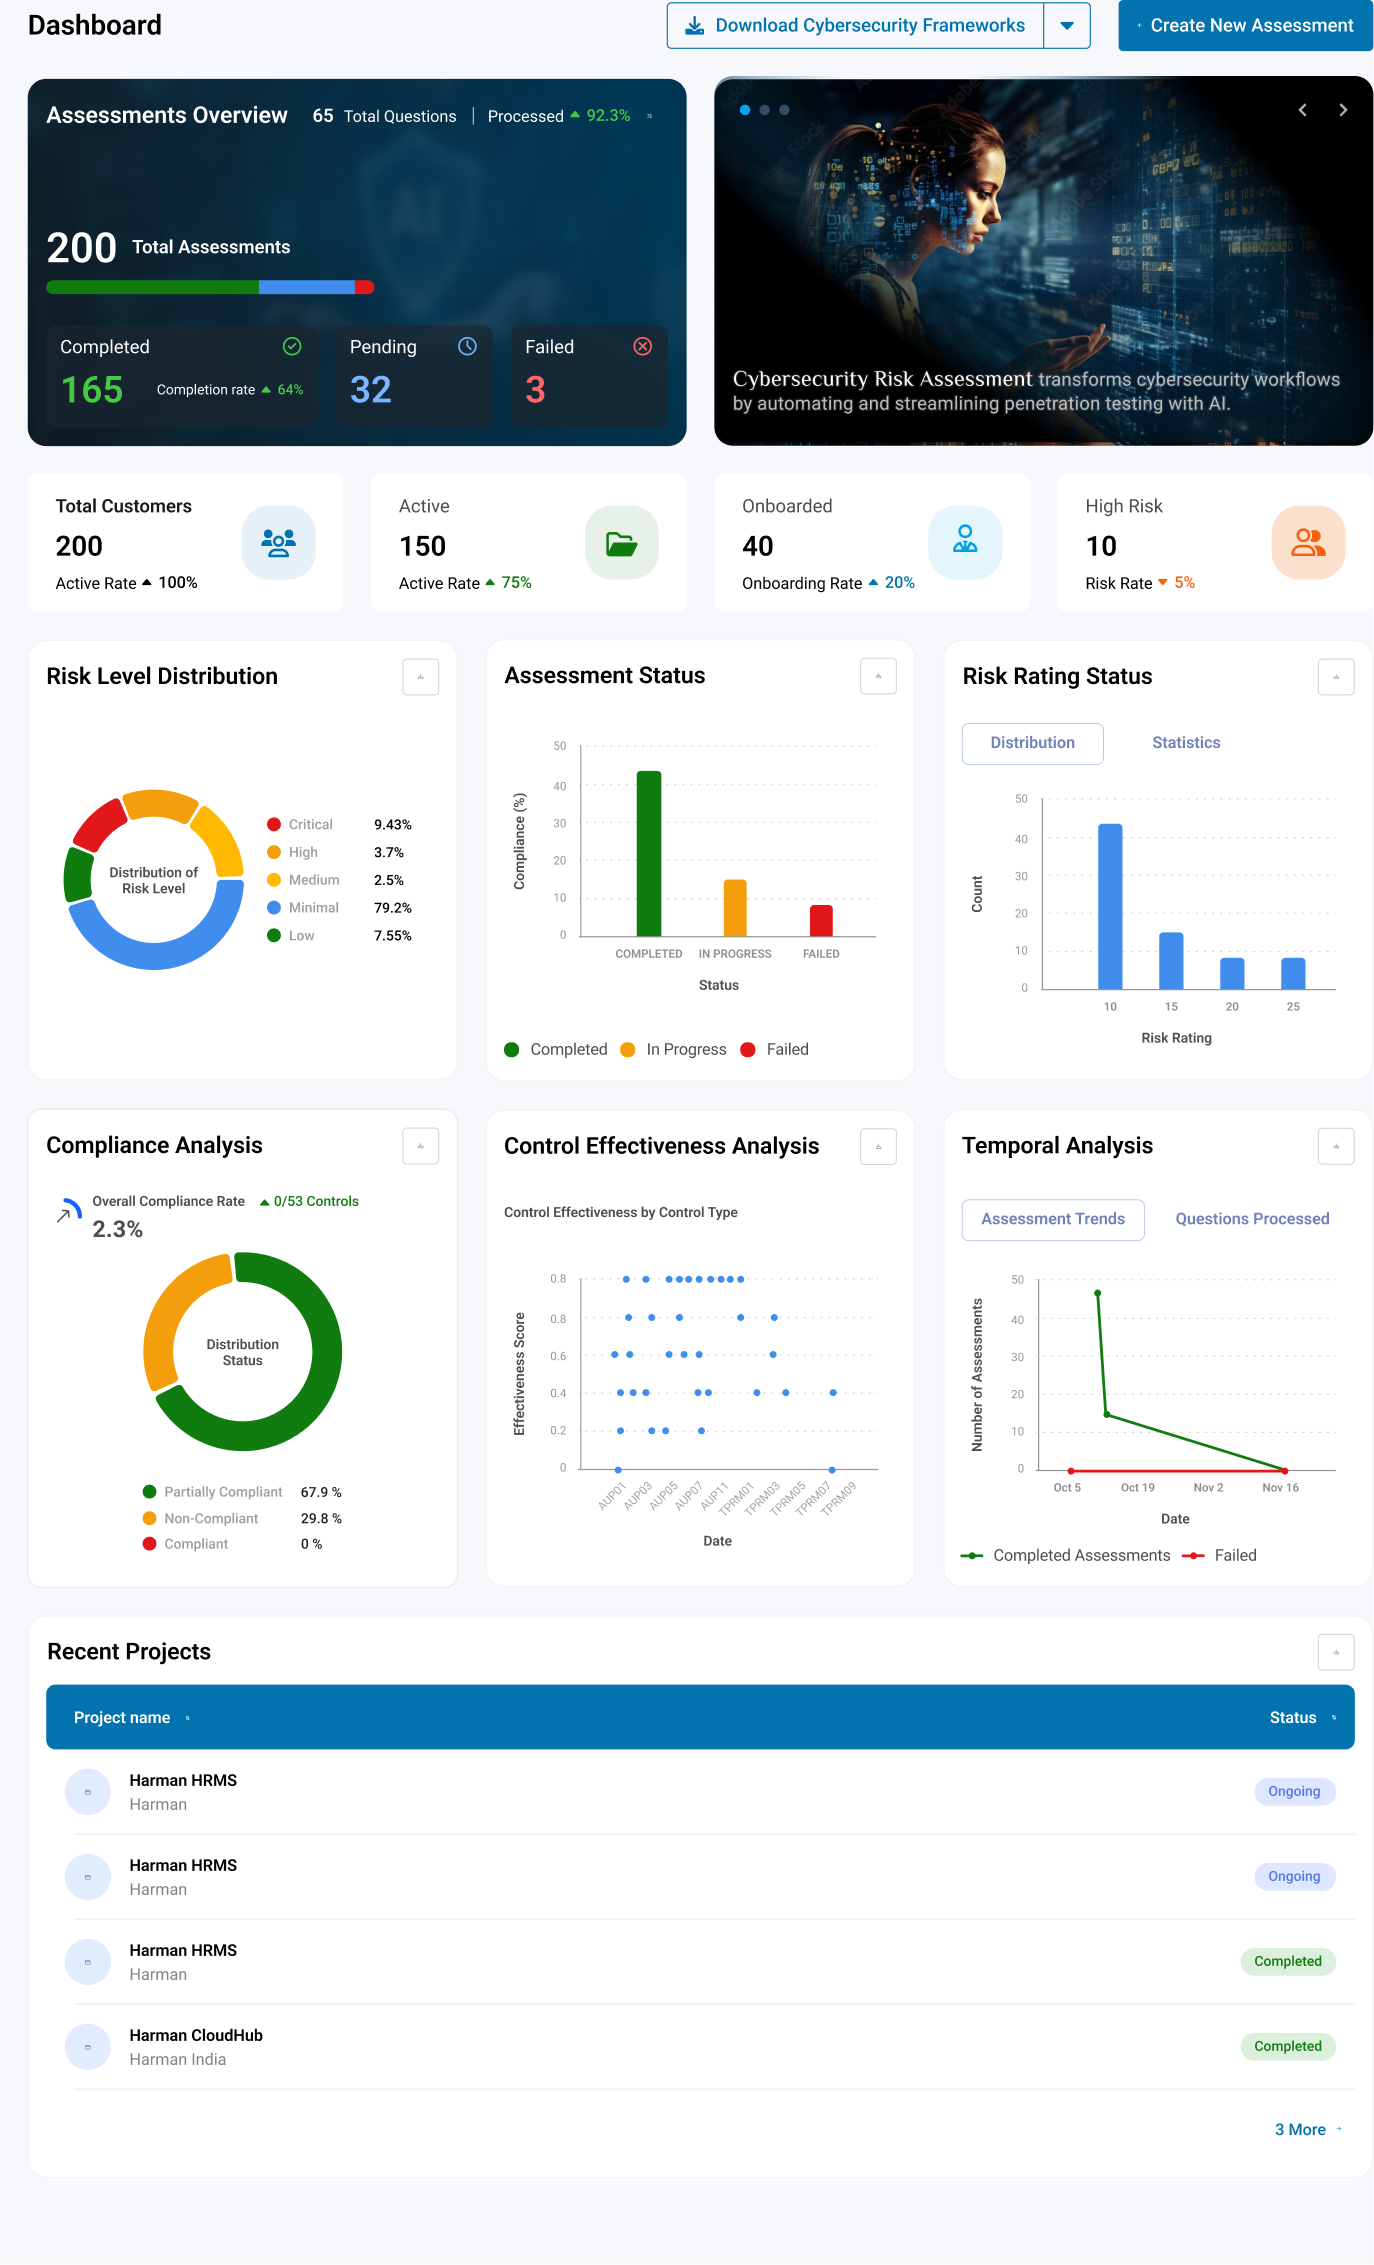
Dashboard
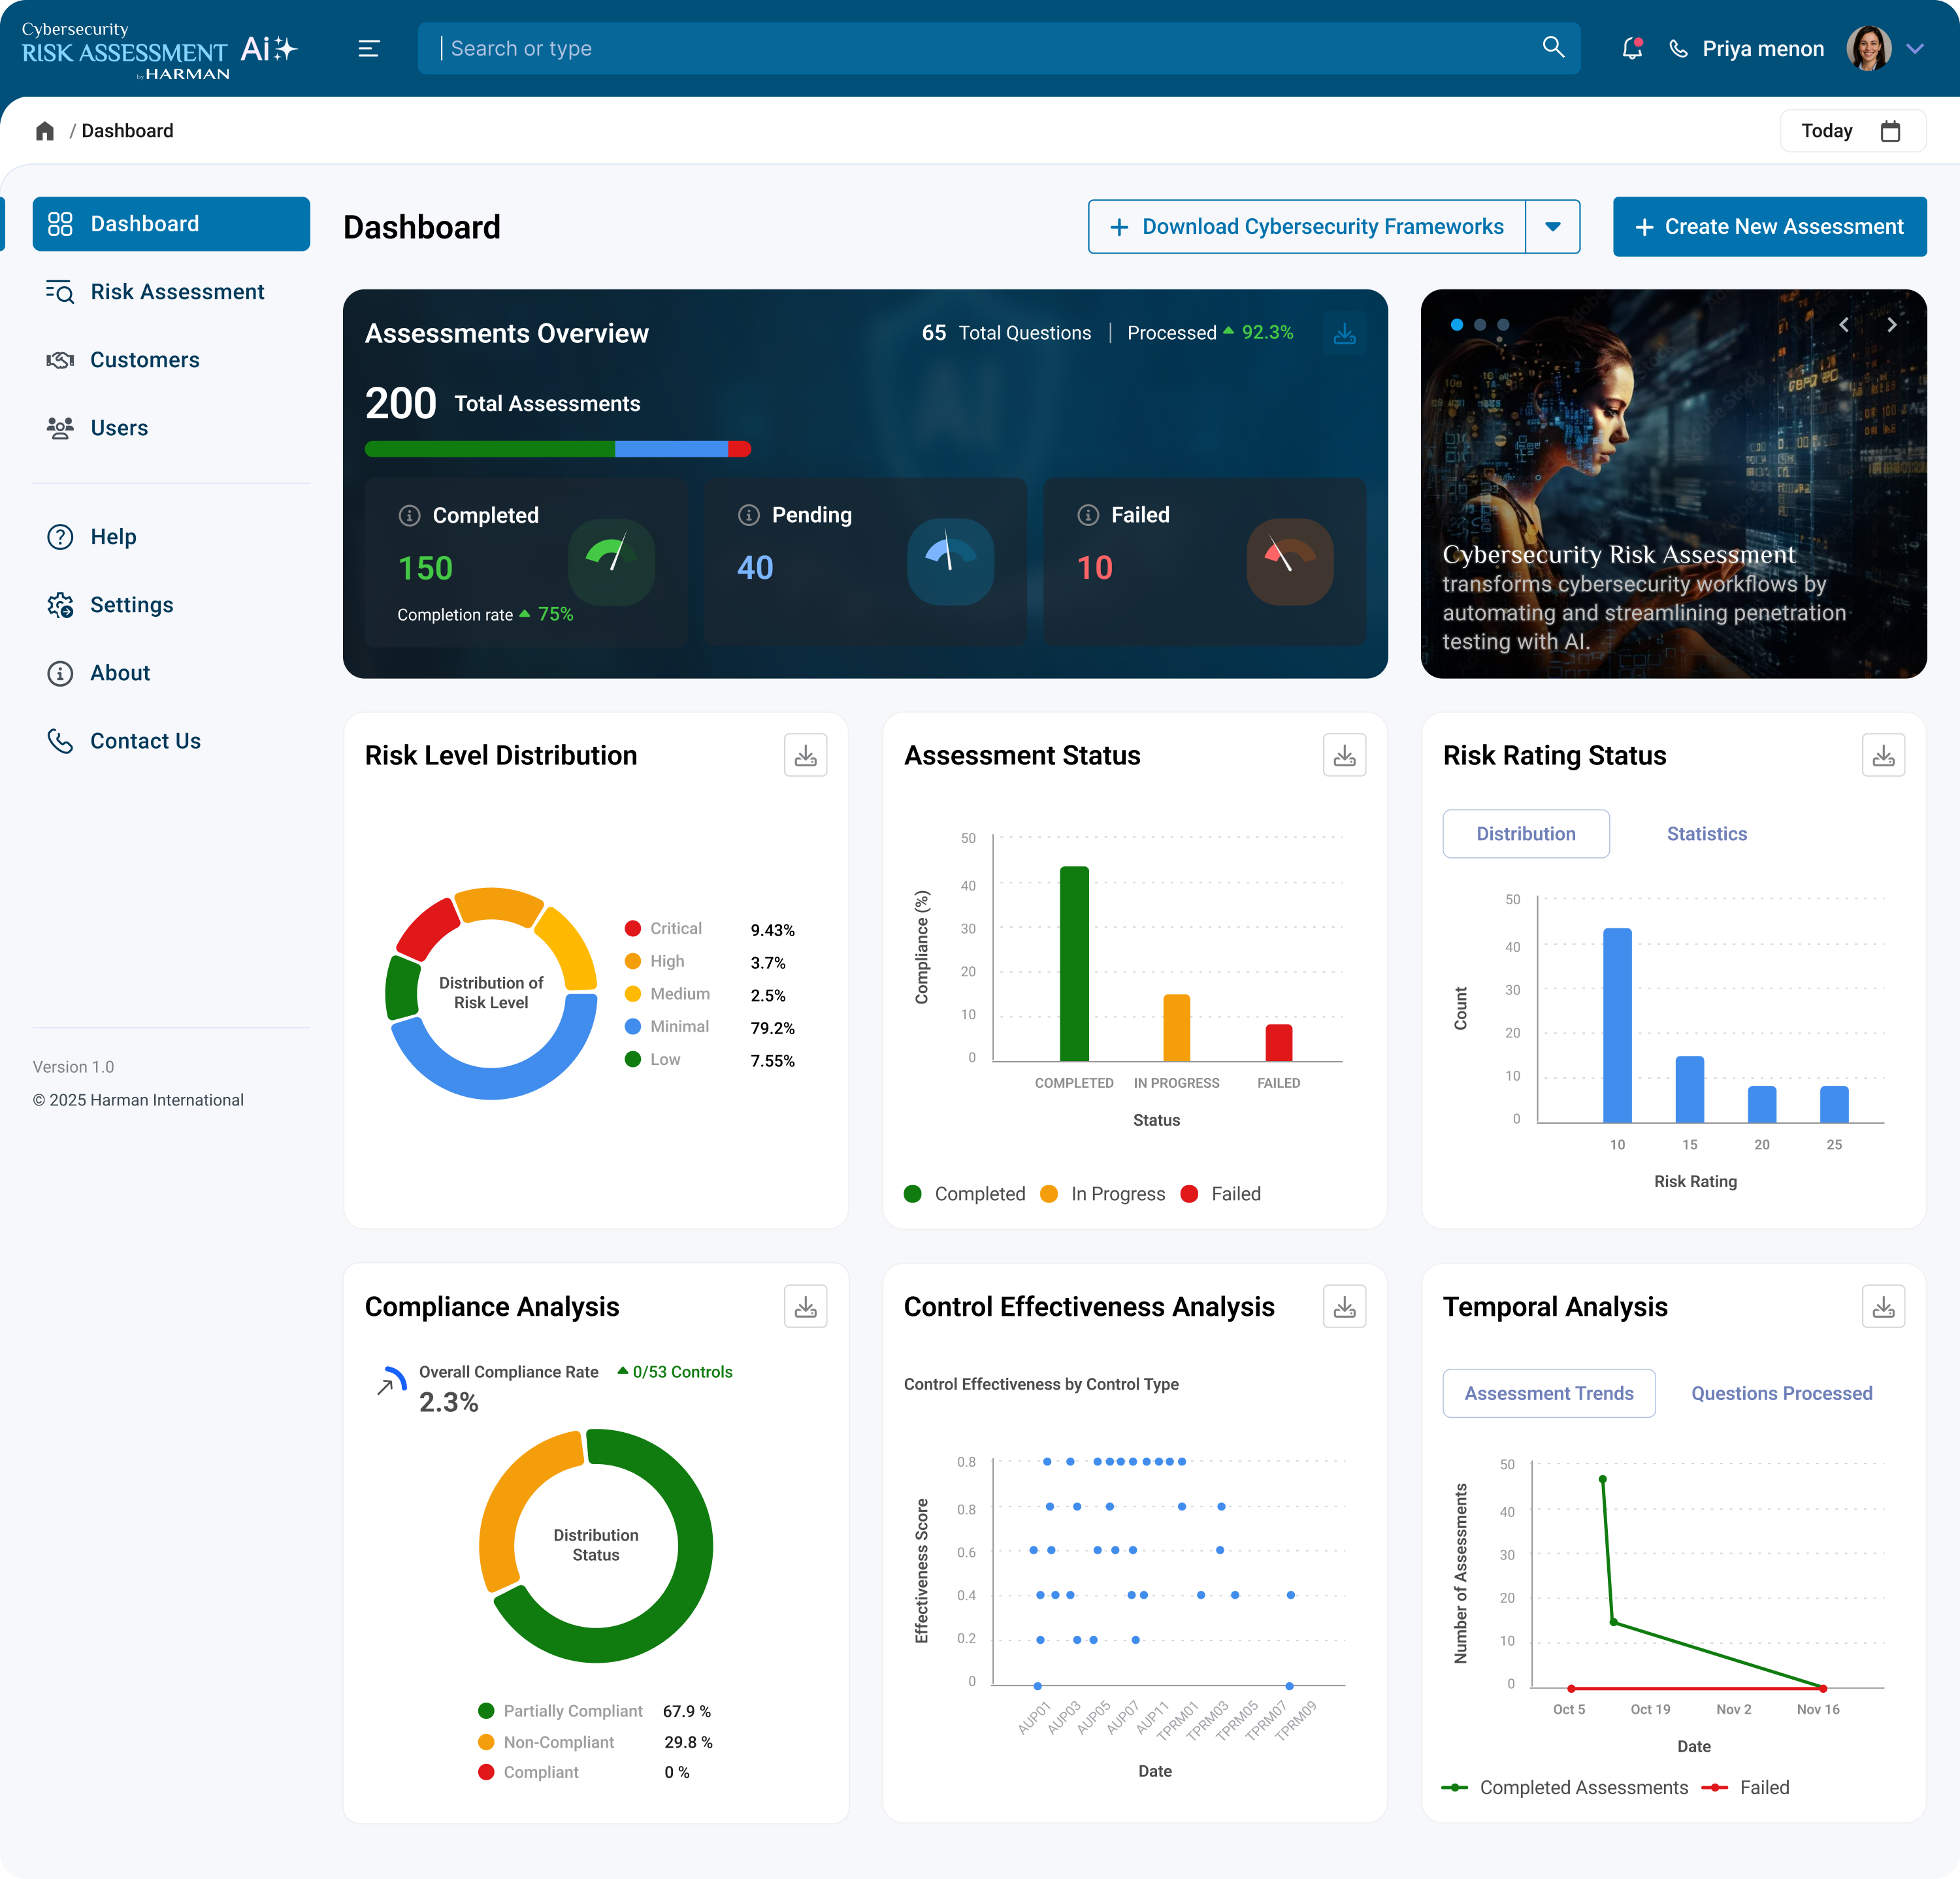
Risk Assessment
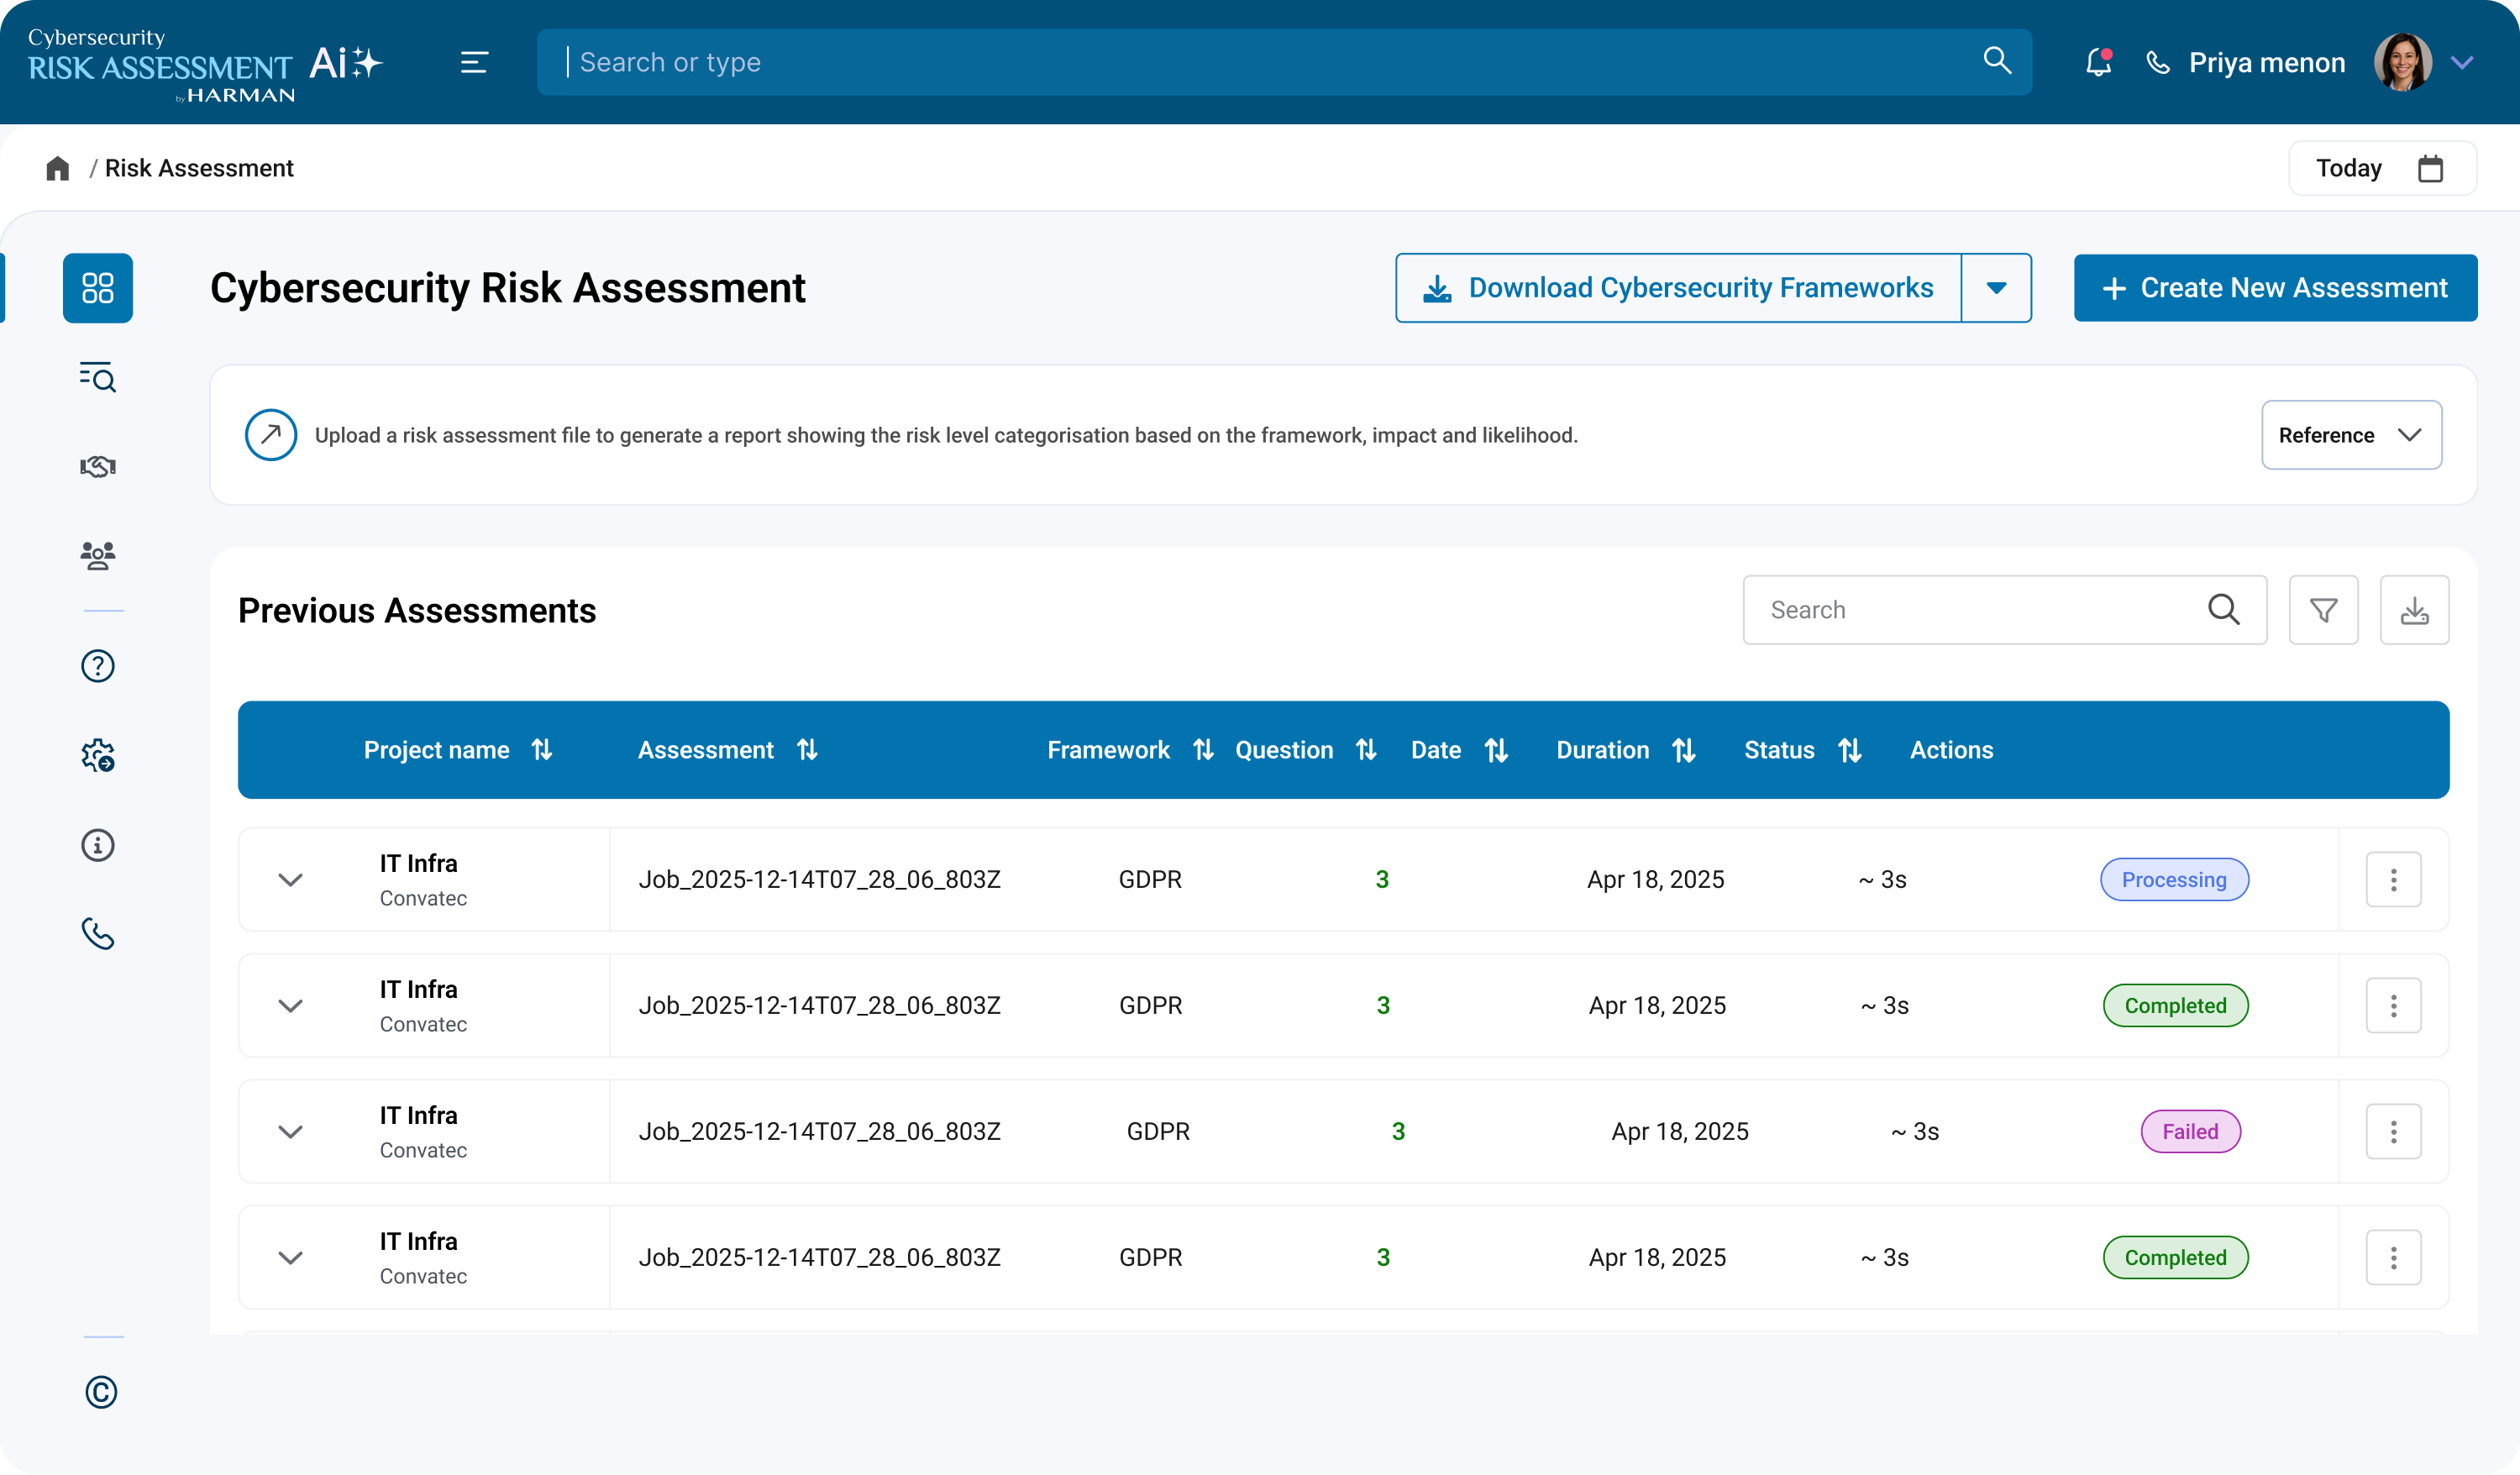
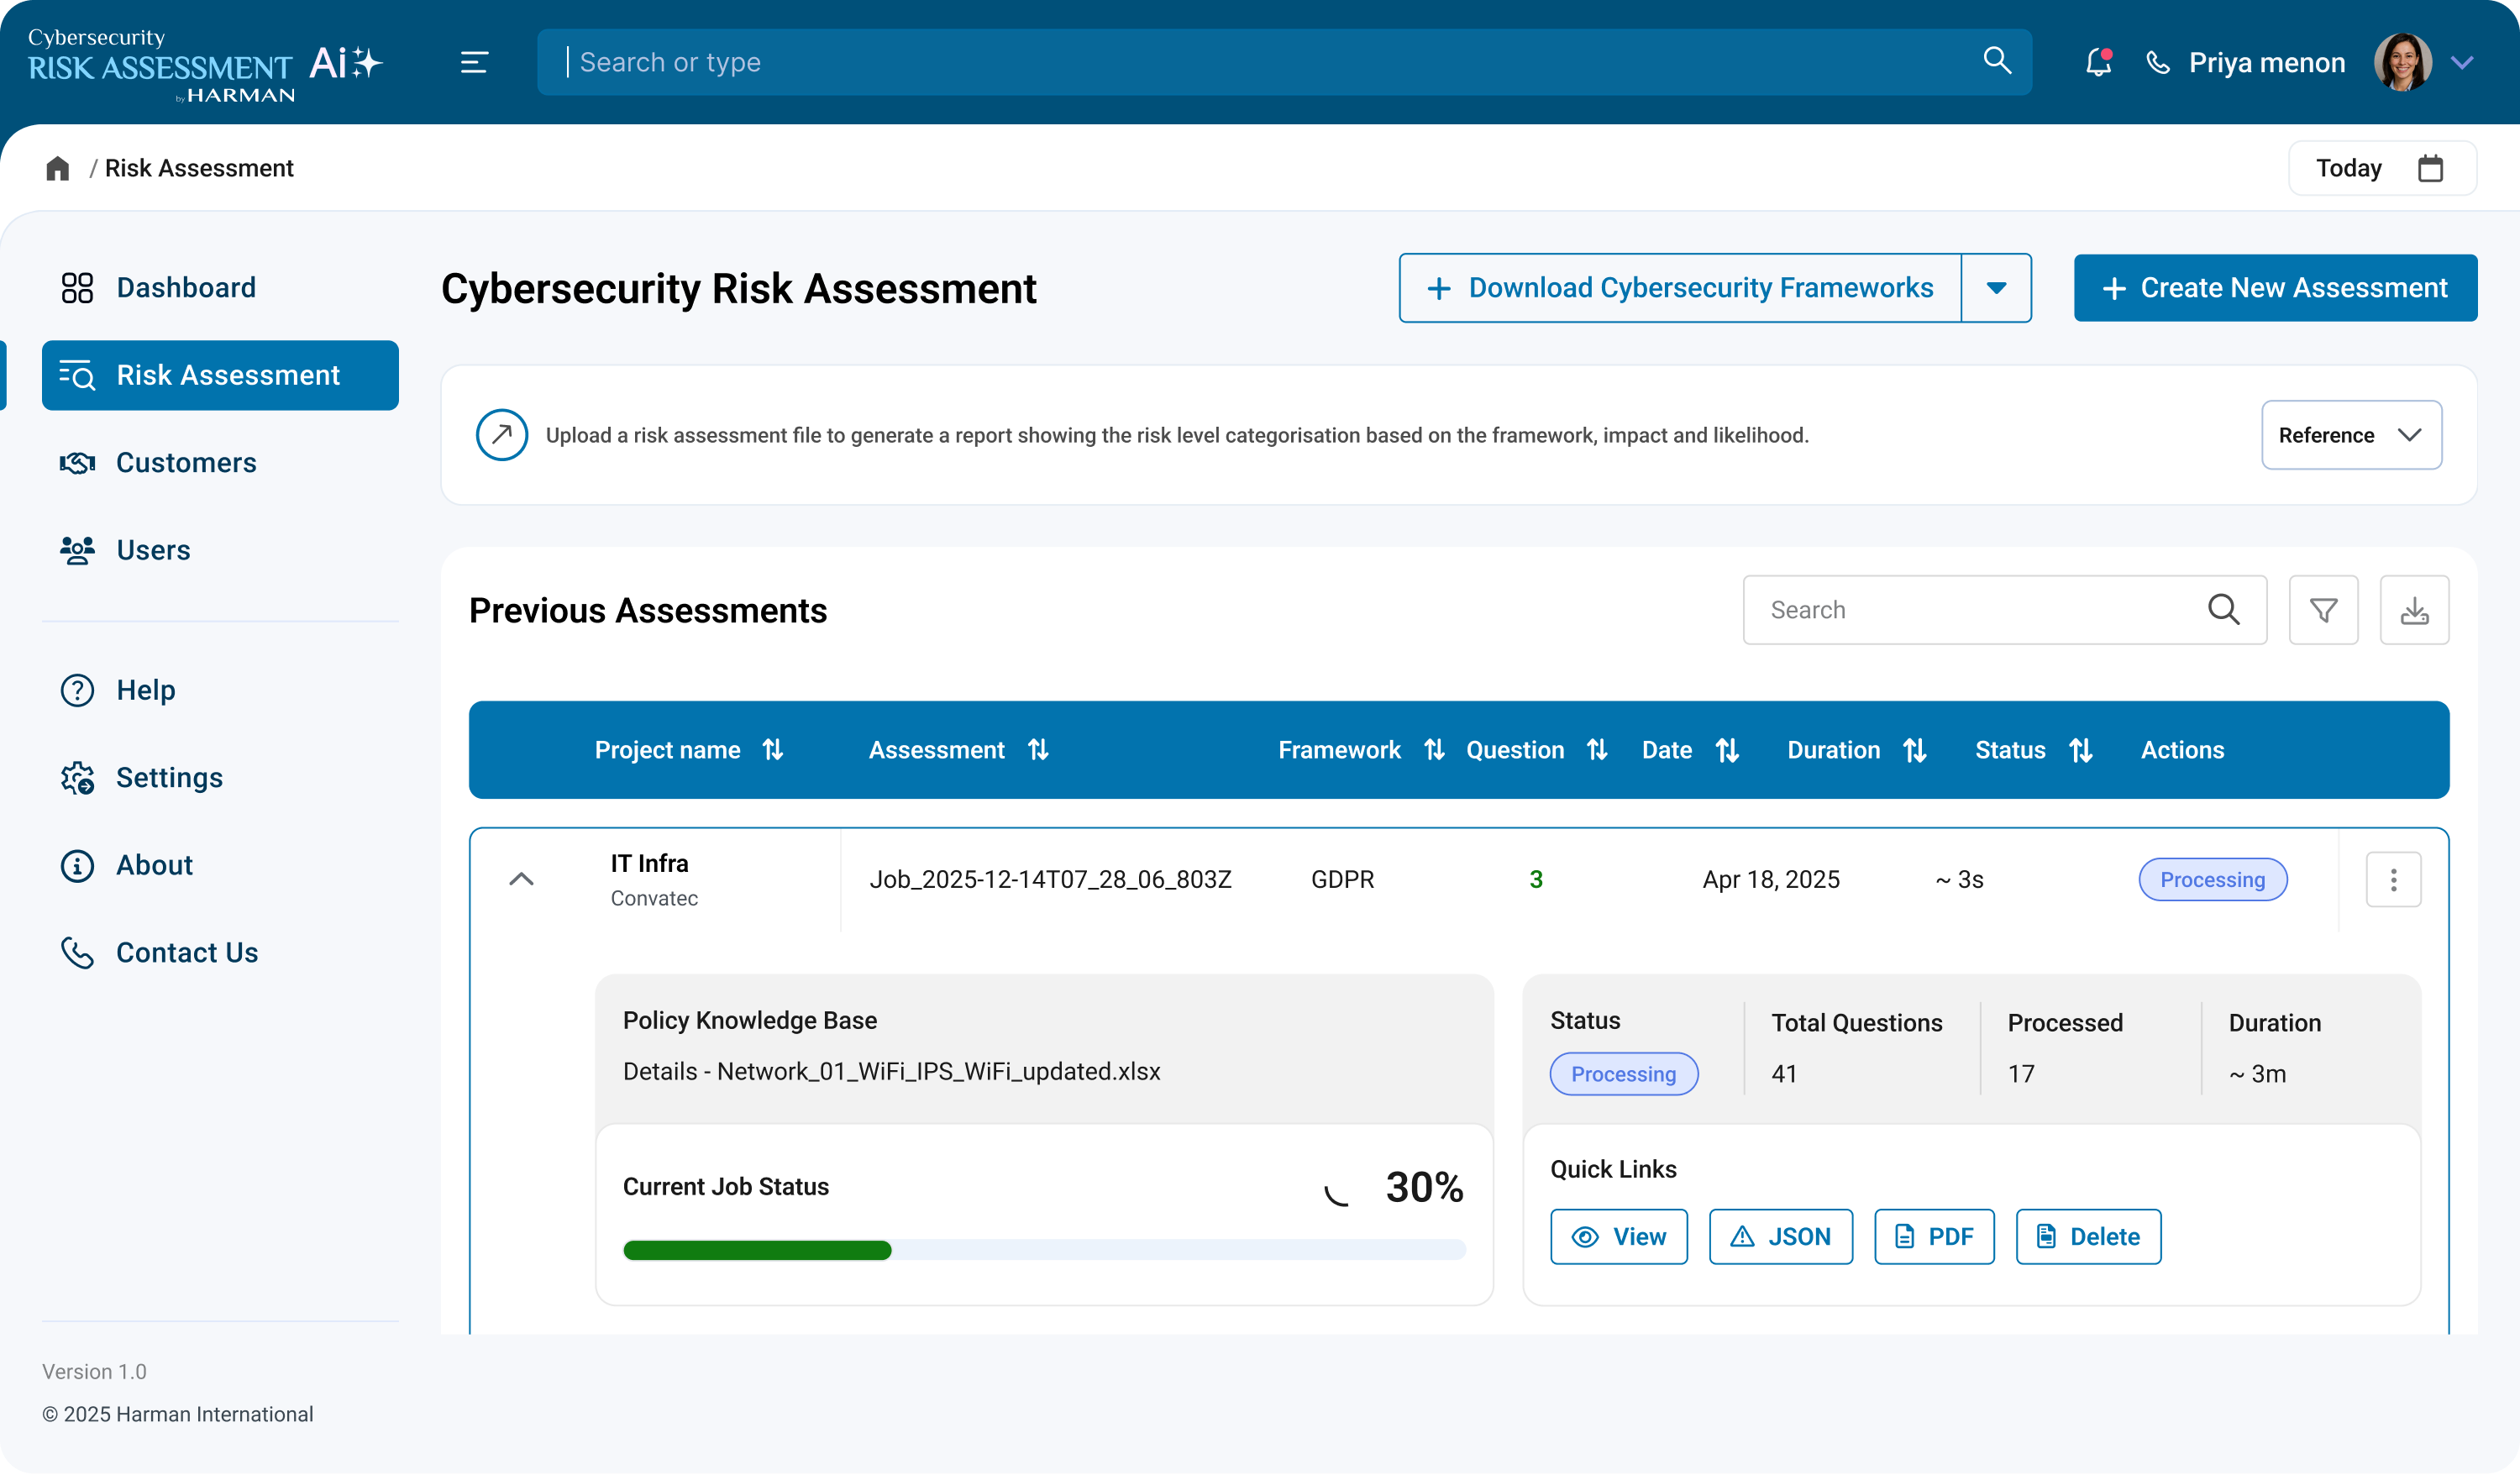
Assessment In Progress
Responsive Design





Interactive Prototypes
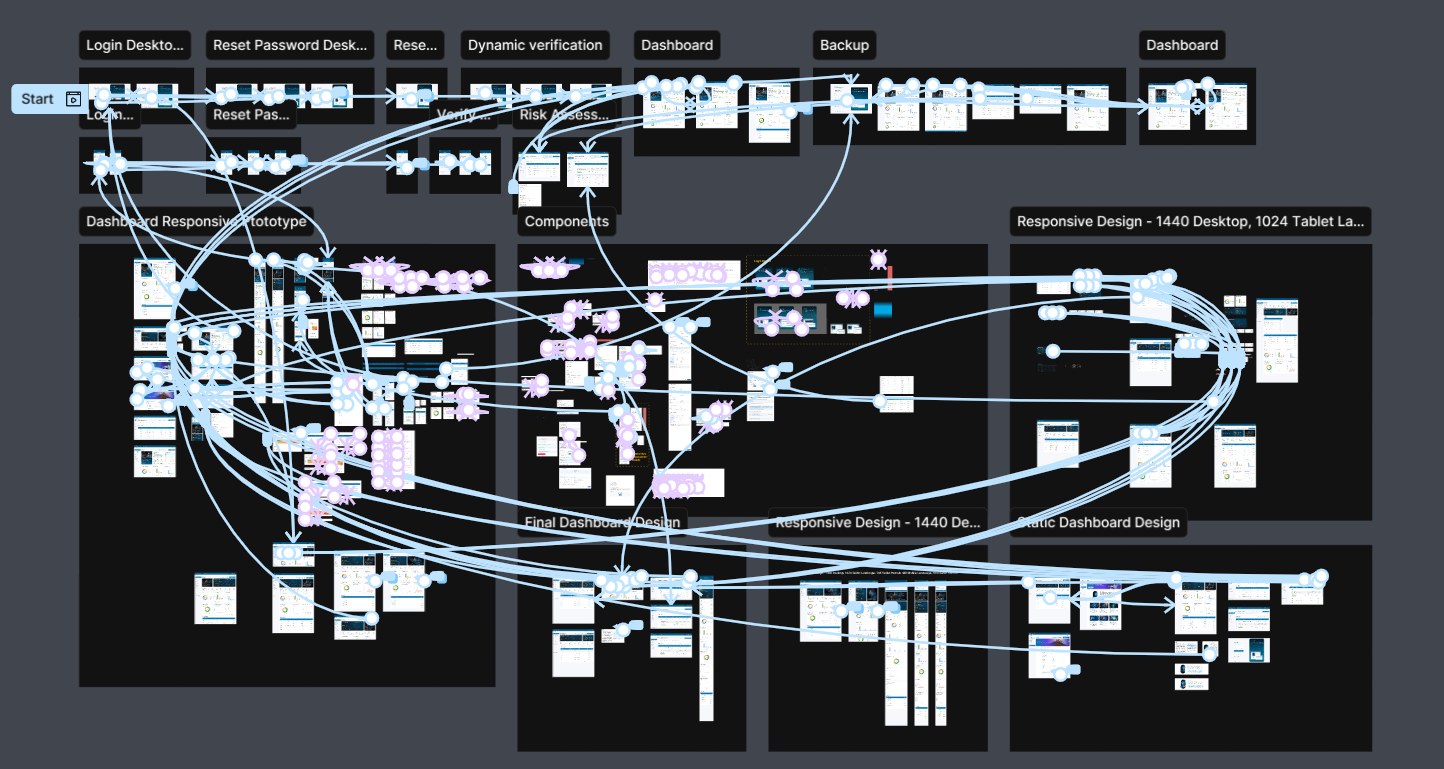
View Prototype


Key Learnings
Conceptualising
Communication with Stakeholder
Informed Decision-making
Effective Research Practices
Iterative Design Approach
Collaborative and Cross-functional Skills

Co-creating with different stakeholders and across cross-functional teams and the importance of incorporating their perspectives and inputs to design a holistic solution within the constraints.
Use research findings and behavioral analysis to back the service offerings and drive key business decisions.These are some of my many learnings in this a year and half long intense and fulfilling project.
